# Causely changelog
> Full content of every Causely release note.
This file contains all documentation content in a single document following the llmstxt.org standard.
## v1.0.101
### November 12, 2025
Version v1.0.101
#### MCP Server: Causely's Causal Reasoning Engine, Now in Your IDE
The new MCP Server gives you direct access to Causely's Causal Reasoning Engine (CRE) from any MCP-compatible IDE.
You can now pull the full causal context of an inferred cause to automatically generate a code fix and a pull request, without leaving your workflow.
This capability is in Early Access; let us know if you'd like to try it in your environment.
Read the blog post announcing MCP Server for IDEs: [Introducing Causely’s MCP Server](https://www.causely.ai/blog/introducing-causelys-mcp-server).
#### Telemetry Integrations in the UI
You can now add and manage [telemetry data sources](/telemetry-sources/) directly in the Causely UI. The Integrations experience shows:
- The health of all configured sources
- The last discovery time and data retrieved
- Recommendations for which data sources to prioritize next
By expanding your telemetry coverage, Causely builds a more complete causal model of your system, improving precision in root cause inference and proactive detection.
:::tip
Adding additional instrumentation enhances Causely's ability to model service-to-service communication and automatically detect reliability risks.
:::
#### Background Operation Root Causes
Causely's causal model now includes background operations such as asynchronous message consumers (Kafka, RabbitMQ, and more).
This enables automatic inference of slow consumer root causes for message-driven workloads.
[Learn more in the docs](https://docs.causely.ai/reference/root-causes/applications/#slow-consumer).
#### Expanded Elasticsearch Support
Causely now supports additional [Elasticsearch indices](/telemetry-sources/elasticsearch), ensuring that the most relevant logs are linked to each inferred root cause — giving you the “why” behind degradations with more context and precision.
#### Did you know?
Not only can Causely leverage Grafana [Alloy](/telemetry-sources/grafana#alloy-valuesyaml), [Loki](/telemetry-sources/grafana#loki-integration) and [Beyla](/telemetry-sources/ebpf) as telemetry sources, but you can also use the [Grafana Plugin](/workflows/grafana-plugin) to bring Causely's causal insights directly into your Grafana dashboards.
[Learn more in the docs](/workflows/grafana-plugin).
#### Bug Fixes and Minor Improvements
- Automatically discover Docker services exposed on host IPs for more complete topology mapping
- Make OpenTelemetry sample rate configurable to maintain mediation health
- Show active scope and filter details in the Topology view
- Update service graph to display intermediate services along route destinations
---
## v1.0.103
### November 24, 2025
Version v1.0.103
#### Reliability Delta
Reliability Delta lets you compare two snapshots of your environment to understand whether
reliability has improved, regressed, or meaningfully changed. Snapshots capture the state of
your services, dependencies, and infrastructure over a defined window (up to two hours).
By comparing snapshots, Causely highlights differences in reliability, service behavior,
root causes, and resource utilization, helping you evaluate release candidates, validate
load tests, and confirm production stability with confidence.
[Learn more](/in-action/reliability-delta/).
#### OTel Collector Support for Prometheus Metrics
Causely now supports ingesting Prometheus metrics via the OpenTelemetry Collector.
This allows teams already standardizing on OTel pipelines to route metrics,
alongside existing exporters for Kafka, MongoDB, MySQL, Postgres, RabbitMQ, Redis,
and common language runtimes, directly into Causely through your OTel collector.
[Learn more](/telemetry-sources/prometheus/).
#### Did you know?
Causely provides native cloud integrations with [Azure](/telemetry-sources/azure), [GCP](/telemetry-sources/gcp), and [AWS](/telemetry-sources/aws)
to bring your cloud resources and managed services into your causal model.
#### Minor Improvements
- Improved remediation messages for external services, making recommended actions clearer.
- Added detail on attribute updates for configured integrations, making it easier to verify that data is flowing correctly into the mediator.
- Enhanced presentation of key evidence in the Root Cause Summary view for faster analysis.
- Reduced noise in Beyla tracing by ignoring Datadog Trace API endpoints.
- Increased relevance of Datadog event ingestion by pulling only the last hour of events.
---
## v1.0.105
### December 9, 2025
Version v1.0.105
#### Impacted Services Graph
Causely now provides a dedicated Impacted Services Graph that makes it easier to understand how a reliability issue propagates across your environment.
This new view enables you to:
- Visualize the full impact of a root cause, including all degraded downstream services
- See live service-level metrics in context, directly within the graph
- Toggle extended hops to understand which additional services may be at risk if the issue remains unresolved
- Navigate seamlessly to the Live Topology view for any degraded service to continue investigation in real time
This makes it significantly easier for teams to assess the scope, urgency, and potential blast radius of reliability issues.
#### Datadog Dual Shipping & Hybrid Environment Support
Causely now supports Datadog APM dual shipping, allowing teams to reuse existing Datadog instrumentation while sending trace data from the Datadog collector directly to the Causely mediator without incurring additional egress costs.
This release also extends Datadog support to services running outside Kubernetes (such as standalone EC2 instances). As a result, Causely can now construct a complete, accurate causal model across heterogeneous environments, a prerequisite for:
- Confidently validating reliability in pre-production (load tests, release candidates)
- Continuously assuring reliability in production
- Detecting drift or regressions caused by infrastructure or configuration changes
Datadog monitors can also be ingested as symptom identifiers, enriching Causely's understanding of the environment.
[Learn more](/telemetry-sources/datadog/).
#### Expanded Dynatrace Support for Mixed Container Platforms
Causely's Dynatrace integration has been expanded beyond Kubernetes to include ECS-based services. This ensures that teams using Dynatrace across multiple container platforms get a unified dependency and service map that reflects how the system actually behaves under change.
Enhancements include:
- Cross-platform stitching between ECS and Kubernetes workloads
- Service-level metric ingestion for more reliable behavior modeling
- Improved tracing fidelity for clearer dependency pathways
Together, these improvements help Causely maintain an end-to-end causal understanding of services regardless of where they run, strengthening reliability assurance across hybrid environments.
[Learn more](/telemetry-sources/dynatrace/).
#### Did you know?
Causely allows you to automatically remediate resource contention issues directly from the UI, helping you restore performance faster, reduce time to resolve, and keep services within SLOs.
When Causely identifies a deterministic Resource Contention root cause, you can trigger automated remediation or apply a guided fix with one click. [Learn more](/in-action/automate-remediation/).
#### Minor Improvements
- Added the ability to filter on external services
- Added support for multitenant Loki
- Improved Ask Causely search by enabling lookup by entity name
- Reduced duplication of services across Docker, Nomad, and Kubernetes environments
- Updated default SLO burn rate threshold from 2 to 4, making urgent root causes more reflective of sustained reliability degradation rather than short-lived spikes
- Improved snapshot reliability by fixing an issue that sometimes caused snapshot generation to time out in the UI
- Reduced Beyla log verbosity so logs remain clean and actionable without excessive noise
- Added notifications for missing agent coverage on nodes, making it easier to detect when parts of the infrastructure are not reporting the telemetry required for complete reliability analysis
---
## v1.0.108
### December 23, 2025
Version v1.0.108
### Expanded Messaging Queue Causal Model
We’ve expanded Causely’s causal model for messaging queues to support richer topologies across common messaging technologies, including **Amazon SQS, Amazon SNS, and RabbitMQ**. The model now represents exchanges, queues, and data flows in greater detail, enabling more precise causal analysis of messaging-driven systems.
As part of this expansion, we’ve introduced a new root cause focused on unexpected publish rate spikes:
**Producer Publish Rate Spike**
Service, an HTTP path or RPC method is publishing messages at a significantly higher rate than normal, causing queue depth to grow and producer message rate to increase. This surge creates backpressure and can overwhelm downstream consumers, leading to service degradation.
With this release, Causely now supports both **SNS and SQS** as first-class messaging technologies.
### Expanded Redis Support
Causely now supports **Amazon ElastiCache** and **Valkey**, expanding coverage for managed Redis deployments.
This enables identification of Redis-specific root causes, such as [Redis Connection Pool Saturated](/reference/root-causes/applications/#redis-connection-pool-saturated), while visualizing how data flows to and from managed Redis services across upstream APIs and topics, as well as downstream consumers (see Dataflow Map).
### Minor Changes
- Updated root cause display names to clearly emphasize code regressions when issues are caused by recent code changes
- Clarified SLO remaining budget views
- Marked external services with an expected NO-SLO tier
- Filtered external services from service tier views used for service prioritization
- Improved network endpoint normalization to prevent misinterpretation of service-to-service communications caused by inconsistent DNS name resolution
---
## v1.0.79
### May 2025
v1.0.79
#### New Landing Page: See What's Most Interesting in Your Environment
The **new Causely landing page** gives you a high-signal, low-noise view of your **Root Cause Headlines** in your environment over the last 24 hours.
Whether it's a sudden spike in latency, a critical root cause affecting your services, or key SLO risks, we now highlight it the moment you log in.
This helps teams prioritize actions based on impact.
#### Ask Causely: Your Incident Copilot in Causely and Slack (Early Access)
Introducing **Ask Causely**, your LLM-powered assistant built for real-time operational insight. Whether you're in Slack or in the Causely UI, Ask Causely helps you resolve incidents faster and improve service health.
What it can do:
- Respond to users' natural language questions, like "Which services are currently impacted by active root causes?"
- Get context-aware answers: **Root cause + symptoms + suggested next steps **
- Integrated into both **Slack** and **Causely Web UI**
Want to enable Ask Causely? Reach out to your Causely team to activate early access.
#### Simplified Navigation: Focused on What Matters Most
We've rethought the structure of Causely's interface to spotlight our core value: real-time, automated analysis of what's causing service latency and errors.
What's improved:
- Streamlined layout with **fewer distractions **
- **Root causes now front and center**
- A new **getting-started checklist** to help you activate value faster
This refined navigation ensures that your attention goes straight to high-impact issues.
#### Bug Fixes and Minor Improvements
- **Smarter Root Cause Alerts** : We now notify you only for root causes that impact multiple services beyond just SLO violations—reducing noise and helping you prioritize real incidents.
- **Refined Symptom Deactivation Logic**: Error symptoms are now tied to real request activity, preventing premature deactivation or activation in idle services.
- **[Per-Service Thresholds](/configuration/thresholds)**: Teams can now configure latency and error thresholds for individual services, replacing the default ML-based learned thresholds. This allows for more fine-grained alert tuning and better alignment with service-specific expectations.
- **[Splunk OnCall Integration](/workflows/splunk-on-call)**: Causely now supports Splunk OnCall notifications, expanding your ops toolchain with automated incident routing.
- **[AWS Discovery & Metrics Improvements](/telemetry-sources/aws)**: We've added pagination for AWS ALB discovery, improved tag handling, and now set ALB latency directly from observed values for faster, more accurate symptom detection.
---
## v1.0.81
### June 2025
v1.0.81
#### Ask Causely: SQL Query Analysis & Service Graphs
Ask Causely has leveled up. This release also comes with additions to answering questions about incidents and metrics,
it now helps you to analyze and troubleshoot your slowest SQL queries and provides automatic visualization for query
topology and service graphs.
Want to enable Ask Causely? Reach out to your Causely team to activate early access.
#### Grafana Plugin is Now Publicly Available
We're excited to **officially launch the Causely plugin for Grafana**! Now anyone can bring Causely's root cause analysis directly
into their existing dashboards with no extra context-switching required!
**Latest Highlights:**
- Root Cause Panel: See urgent issues and causal summaries in place.
- Root Cause Headlines: Clear, contextual insights without leaving Grafana.
- Unhealthy Services Panel: Quickly identify degraded services and their downstream impact at a glance.
This marks a major step in bringing Causely's causal intelligence to where your teams already work.
With the new plugin, Grafana becomes not just a place for metrics, but a place for action.
We'll continue to expand the plugin with even more capabilities in upcoming releases.
#### Enriching Root Cause Analysis with Trusted Signals from Prometheus, Alertmanager, and Checkly
Causely now ingests alerts from Prometheus, Alertmanager, and Checkly—bringing the signals you already trust into our causal engine. These alerts are automatically mapped to known symptoms in your environment, giving incidents immediate structure, historical continuity, and causal depth.
- **Prometheus + Alertmanager**: Pull alerts in real-time and map them to symptoms in your knowledge graph—enhancing situational awareness and accelerating investigations.
- **Checkly**: API check failures are now linked to the services they impact and surfaced as active symptoms, giving synthetic monitoring real operational context.
- **Symptom Activation/Deactivation**: Alerts can now directly toggle symptom states, powering more dynamic, accurate, and automated RCA workflows.
With these integrations, Causely doesn't just observe alerts—it interprets them in context. You're extending your causal graph with trusted telemetry, making every incident easier to understand, triage, and resolve.
#### Did you know?
Causely automatically discovers and visualizes your service dependencies—no manual config required.
We analyze runtime communication patterns (HTTP, gRPC, SQL, Kafka, etc.) to give you a live, layered map of your architecture—from services to infra to messaging layers—enabling more accurate root cause analysis and impact prediction.
#### Bug Fixes and Minor Improvements
- **Weekly Email Summaries**: Automatically receive a weekly summary of incidents and RCA results to stay aligned.
---
## v1.0.83
### July 1, 2025
v1.0.83
#### Improved Root Cause Views
We've redesigned our Root Cause views to help you quickly identify and address the most urgent service-impacting issues.
The new interface prioritizes critical root causes based on their impact scope and severity, making incident triage more efficient than ever.
#### API Documentation Now Available
Our comprehensive [GraphQL API documentation](/api) is now available! Programmatically access Causely's root cause analysis engine, query defects, and integrate with your CI/CD pipelines.
#### Smarter Post-Deployment Analysis
Causely now provides enhanced visibility into code change-related root causes with improved clarity around version change events:
- **Immediate Detection**: Catch resource usage changes right after a deployment to identify regressions faster
- **Precise Correlation**: Version timestamps are now directly correlated with resource metrics like CPU, memory, and latency
- **Before vs. After Insights**: Get proactive visibility into what changed pre and post-deployment
- **Automatic Code Change Attribution**: Causely automatically infers if a root cause stems from a code change, helping teams quickly connect symptoms to recent deployments
This feature is particularly valuable for understanding the real performance impact of new releases on your services.
#### Better Visibility Into Asynchronous Data Flows
Understanding complex message flows across your distributed system just got easier with our improved data flow graphs:
- **End-to-End Tracing**: Follow messages from publish to RPC method or HTTP path, even across multiple service hops
- **Topic Filtering**: Isolate behavior for specific customers or queues by filtering data flows by topic
- **Causal Integration**: These improvements are fully integrated into our causal engine, enhancing root cause accuracy for asynchronous systems
#### Did you know?
Scopes in Causely allow you to define and manage custom subsets of your environment's topology. As Causely automatically discovers the full topology of your environment, it can present a rich but potentially overwhelming set of entities—services, infrastructure components, and identified problems. Scopes help you focus on the specific subset of data that matters most to your role, responsibilities, or current investigative tasks.
Learn more about scopes and how to use them in our [documentation](/configuration/scopes).
#### Bug Fixes and Minor Improvements
- **Database Performance**: Added indices to active actions and increased max DB pool connections for better performance
- **Slack Integration**: Enhanced support for users in multiple Slack teams
- **Kubernetes Improvements**: Added option to disable entity log collection from Kubernetes and improved pod metadata for network endpoints
- **Alert Management**: Added alerts as context in symptoms and implemented continuous sender for alert manager notifications
- **Log Management**: Optimized log storage by limiting to 1000 log lines per evidence
- **UI Improvements**: Fixed time duration format display and headline database scanning
- **Root Cause Quality**: Filtered out root causes with only low probability symptoms and fixed flapping issues due to equal probabilities
- **Monitoring Enhancements**: Added support for symptom monitoring from Prometheus and improved topology scraper metrics for SLOs
- **SQL Parsing**: Enhanced SQL query parsing for better database performance analysis
- **Email Notifications**: Improved weekly email summary delivery system
---
## v1.0.84
### July 21, 2025
v1.0.84
#### Root Cause Impact—Now in Architectural Context
Quickly see which services are impacted by a root cause. Causely now provides a direct view of the services being affected, along with a link to the live service-to-service topology graph.
This helps teams align on the scope of the issue, prioritize response, and collaborate on remediation—all from a shared system view.
#### Easier Alerting Integration Setup and Testing
Streamline your incident response workflows. We now support in-product testing for alerting integrations (like Slack, PagerDuty, and more), so you can confirm everything works before going live.
Causely supports multiple workflow destinations—ensuring your on-call engineers get timely, actionable context in the tools they already use.
#### Fine-Tuned Symptom Activation—Because Every Second Counts
Control how fast (or slow) Causely infers a root cause. You can now customize the [activation and deactivation delays for symptoms](/configuration/symptom-delay) on a per-service basis using Kubernetes labels, Nomad service tags, or Consul service metadata.
By default, a condition must persist for 10 minutes before a symptom becomes active—but now you can tighten that window for mission-critical services or extend it for lower-priority ones. See our [symptom delay configuration guide](/configuration/symptom-delay) for detailed setup instructions and best practices.
This helps you tune responsiveness without sacrificing signal quality.
#### Understand Past Incidents Faster
Explore historical root causes with more precision. You can now sort by services degraded count, start time, or end time to quickly find the root causes that matter most from previous days or weeks.
Whether you're doing a postmortem or scanning for recurring issues, it's now much easier to answer: "What was going on at that time?"
#### Did you know?
Causely uses **eBPF technology** to automatically instrument your applications with zero code changes and minimal overhead.
Powered by Grafana Beyla, our eBPF-based instrumentation extracts rich telemetry data from services written in Go, Java, .NET, NodeJS, Python, Ruby, Rust, and more—without requiring language-specific agents or application modifications.
This zero-effort integration provides actionable insights into service interactions, latencies, and system performance, and it's enabled by default in all Causely deployments.
Learn more about how Causely leverages [eBPF for automatic instrumentation](/telemetry-sources/ebpf).
---
## v1.0.85
### July 29, 2025
v1.0.85
#### Faster Recovery with Resource Contention Remediation
You can now remediate resource contention issues directly from the Causely UI. This helps you resolve incidents faster and restore service performance without breaking your flow.
**Supported Root Causes:**
- **[CPU Congested](/reference/root-causes/infrastructure/#cpu-congested)**: Automatically adjust CPU limits when services are experiencing CPU saturation.
- **[Frequent Memory Failure](/reference/root-causes/infrastructure/#frequent-memory-failure)**: Resolve persistent out-of-memory issues caused by memory leaks or inefficient usage.
- **[Memory Failure](/reference/root-causes/infrastructure/#memory-failure)**: Increase memory allocations to resolve out-of-memory issues.
- **[Ephemeral Storage Noisy Neighbor](/reference/root-causes/infrastructure/#ephemeral-storage-noisy-neighbor)**: Isolate and manage containers that excessively consume ephemeral storage, impacting node stability.
- **[Memory Noisy Neighbor](/reference/root-causes/infrastructure/#memory-noisy-neighbor)**: Isolate and manage containers that excessively consume memory, impacting node stability.
- **[Congested Services](/reference/root-causes/services/#congested)**: Scale service resources to handle increased load.
The remediation interface provides step-by-step guidance and Kubernetes configuration examples, making it easy to implement fixes with confidence.
#### Smarter Urgency Detection for Root Causes
We've improved how Causely flags urgent issues. Root causes that lead to SLO violations, or put your SLOs at risk, are now automatically marked as Urgent and sent to your alerting channels (for example, [Slack](/workflows/slack)) by default. Stay focused on what matters most.
This enhancement ensures that critical issues requiring immediate attention are automatically prioritized and routed to the right teams, reducing response times and improving incident management workflows.
#### Customizable SLO Settings
You can now fine-tune SLO targets and burn rate thresholds within Causely to align with your team's reliability goals. This helps improve the precision of urgency detection and alerting.
**Key Features:**
- Configure custom SLO targets for different services
- Set burn rate thresholds to control alert sensitivity
- Align reliability goals with business requirements
- Improve alert precision and reduce false positives
This feature is currently in preview. Check out our [SLO Configuration documentation](/configuration/slo-configuration/) for detailed setup instructions.
#### Did you know?
Causely supports multiple sources for tracing out of the box. While our agents come with [eBPF-based automatic instrumentation](/telemetry-sources/ebpf) out of the box, you can also use [Odigos](/telemetry-sources/odigos),
[groundcover](/telemetry-sources/groundcover), [Grafana Beyla](/telemetry-sources/grafana), or existing [OpenTelemetry](/telemetry-sources/opentelemetry) data.
Additional service dependencies can be identified from [Datadog](/telemetry-sources/datadog) or [Dynatrace](/telemetry-sources/dynatrace) data, giving you flexibility to work with your existing observability stack.
#### Bug Fixes and Minor Improvements
- **Load Balancer Support:** Added support for Google Cloud internal load balancers, enabling better visibility into private service endpoints.
- **Controller Discovery:** Improved discovery of custom controllers such as GitLab Runner to enhance coverage of user-defined Kubernetes workloads.
---
## v1.0.88
### August 11, 2025
v1.0.88
#### Root Cause View—Sort Historical Root Causes by Symptom Count and Duration
Understanding what happened in past incidents is key to preventing them in the future and conducting more effective postmortem analyses. We've made this easier with new sorting options in the Historical Root Causes view:
- **Symptom Count**: Focus on root causes that triggered a significant number of symptoms. These often represent issues with a large blast radius that, if they recur, can have substantial impact on the environment.
- **Duration**: Pinpoint issues that have been degrading performance for a significant time and need to be addressed to restore stability.
For clarity, the **Symptoms**, **Services Degraded**, **Duration**, **Start**, and **End** columns now reflect the occurrence that matches your selected sort order. For example, if you sort by Symptoms, you'll see the occurrence with the highest symptom count; if you sort by Duration, you'll see the occurrence with the longest duration, and so on.
#### Ask Causely—Smarter Natural Language Investigations
Ask Causely, our natural language interface for understanding what's going on in your environment, just got more powerful.
You can now:
- Access **more metrics across more entities**, including disks.
- Quickly get summarized views of key metrics over time for faster analysis.
- Investigate faster by simply asking questions, even if you're not deeply familiar with the environment.
For example, you can now ask:
> _"Show CPU and memory utilization for the virtual machines with the highest CPU over the last few hours."_
> …and instantly see the charts you need to take action.
#### Did You Know?
**Greater root cause clarity with database instrumentation**
Without adding any additional instrumentation, and by leveraging eBPF, Causely discovers databases in your environment, including Postgres, MySQL, MongoDB, CockroachDB, and more. Causely represents these databases as services and will correctly infer them as the source of root causes impacting other services (for example, service congestion causing increased latency or error rates).
You can gain access to more specific database-related RCs by configuring [Prometheus](/telemetry-sources/prometheus/) as a data source. We support exporters for Postgres, MySQL, MongoDB, CockroachDB, which will enable Causely to infer RCs such as:
- **[Slow Database Query](/reference/root-causes/applications/#slow-database-queries)**: Database queries are taking longer than expected, slowing dependent services and risking resource starvation.
- **[Database Connection Pool Saturated](/reference/root-causes/applications/#database-connection-pool-saturated)**: All available connections in the client-side database pool are in use, blocking new queries and potentially causing requests to hang or fail.
You can take this one step further by adding instrumentation for Postgres or MySQL. By adding specific instrumentation for [Postgres](/telemetry-sources/postgresql/) or [MySQL](/telemetry-sources/mysql/) in Causely, you unlock:
- 3 additional root causes on the **database table** entity:
- **[Malfunction](/reference/root-causes/datapipeline/#table-access-failure-in-database)**: The database table is degraded or erroring, causing slow queries, potential errors, and reduced performance for dependent applications.
- **[Excessive Lock](/reference/root-causes/datapipeline/#contention-on-database-table-locks)**: An abnormally high rate of exclusive locks is blocking concurrent access to the table, creating a performance bottleneck for client applications.
- **[DDL Excessive Lock](/reference/root-causes/datapipeline/#schema-change-causing-table-lock-contention)**: Frequent DDL locks are blocking both reads and writes during schema changes, disrupting and slowing all dependent services.
- The ability to view **slow queries** directly from a database table in the UI.
#### Bug Fixes and Minor Improvements
- Added support for **multi-tenant Mimir deployments**, you can learn more [here](/telemetry-sources/prometheus/#multi-tenant-mimir)
- Improved formatting and clarity in the weekly email digest to make it easier to review notable root causes.
- Enhanced performance of Ask Causely queries when returning large datasets.
---
## v1.0.89
### August 25, 2025
v1.0.89
#### New Features
#### Docker Host Installation Support
Causely now offers a new streamlined installation option for Docker hosts.
This installation method enables telemetry collection and root-cause analysis for containerized services on any Docker-enabled host, complementing our existing deployment options.
**Key capabilities:**
- eBPF-based telemetry collection for Docker containers
- Root cause analysis for services running on Docker hosts
- Easy setup with automated installation scripts
- Support for privileged container deployment with host PID access
Learn more about setting up Causely on Docker hosts in our [Docker Host Installation guide](/installation/docker).
#### Multi-Database Support for MySQL and PostgreSQL
Causely now supports multiple MySQL and PostgreSQL databases using the same secret configuration.
This allows you to monitor multiple databases with the same credentials, reducing the need for separate secret management.
Learn more about setting up multiple MySQL and PostgreSQL databases in our [MySQL Configuration guide](/telemetry-sources/mysql/#option-2-multiple-databases-configuration)
and [PostgreSQL Configuration guide](/telemetry-sources/postgresql/#option-2-multiple-databases-configuration).
#### Did You Know?
**Streamline incident response with CauselyBot webhook integration**
Causely can automatically [forward root cause notifications to your preferred collaboration tools](/workflows/) through [CauselyBot](https://github.com/causely-oss/causelybot/),
our open source webhook service. CauselyBot receives authenticated payloads from Causely and intelligently routes them to platforms like [Slack](/workflows/slack), [Microsoft Teams](/workflows/microsoft-teams), and [incident.io](/workflows/incident-io).
Key capabilities include:
- **Smart Filtering**: Configure custom filters based on severity, entity type, SLO impact, or root cause name to ensure teams only receive relevant notifications
- **Multiple Destinations**: Route different types of incidents to appropriate teams—send critical database issues to the DBA team while routing general service degradations to the on-call engineers
- **Secure Authentication**: Built-in bearer token validation ensures only authorized notifications reach your systems
- **Easy Deployment**: Available as Docker containers or Helm charts for seamless integration into your existing infrastructure
This enables faster incident response by delivering actionable context directly to the tools your teams already use,
reducing mean time to resolution and improving collaboration during critical incidents.
#### Bug Fixes and Minor Improvements
This release focuses on stability improvements and bug fixes across the platform:
- **Impact Graph Resilience**: Improved impact graph calculation to handle missing services gracefully, resulting in faster loading of the impact graph UI.
- **Database Health Checks**: Added comprehensive health checks for cloud-sql-proxy and ping-check database connections for improved monitoring.
- **Redis Span Enhancement**: Improved Redis span collection for better distributed tracing coverage.
- **Service Impact Calculation**: Improved accuracy of service impact calculations to address scenarios where impact was too broad.
- **Entity Deletion Handling**: Improved logic for handling deleted entities in the system. For example clusters or namespaces that have been removed, will no longer be shown in the topology.
- **Copilot Improvements**: Various enhancements to the Causely Copilot functionality.
---
## v1.0.90
### August 29, 2025
v1.0.90
#### Enhanced Impact Understanding with Blast Radius Analysis
Understanding the scope and potential impact of a root cause is critical for effective incident response.
Causely now provides comprehensive **Blast Radius Analysis** that gives you a clearer understanding of both the current and potential impact of every root cause.
**Key capabilities:**
- **Current Impact Assessment**: See exactly which services are currently affected by a root cause and how the issue is propagating through your system
- **Potential Impact Prediction**: Understand which additional services could be impacted if the root cause persists or worsens
- **Risk Assessment**: Evaluate the broader implications of each root cause to prioritize response efforts effectively
- **Visual Impact Mapping**: Clear visualization of impact scope helps teams align on response priorities and resource allocation
This enhanced impact analysis ensures teams can make informed decisions about incident response priorities and resource allocation,
leading to more effective incident management.
#### Datadog Alert Auto-Mapping for Trusted Signal Integration
Causely now automatically maps [Datadog monitors](/telemetry-sources/datadog) to corresponding service symptoms,
enabling you to leverage your existing curated signals for enhanced root cause analysis.
For organizations that have invested in creating reliable Datadog alerts and monitors,
this integration provides a powerful way to incorporate those trusted signals into Causely's causal reasoning engine.
**Key benefits:**
- **Leverage Existing Investments**: Utilize your carefully curated Datadog monitors and alerts within Causely's causal analysis
- **Enhanced Signal Quality**: Combine Causely's automatic discovery with your domain expertise encoded in Datadog alerts
- **Faster Root Cause Identification**: Trusted signals accelerate the path from symptom detection to root cause identification
- **Seamless Integration**: Automatic mapping requires no additional configuration—Causely intelligently correlates Datadog alerts with service symptoms
This capability is particularly valuable for teams who have developed sophisticated monitoring strategies in
Datadog and want to enhance their root cause analysis capabilities.
#### Improved Dataflow Visualization and Topic Metrics
We've enhanced Causely's ability to understand and visualize complex asynchronous data flows across your distributed systems:
**Enhanced Topic Metrics:**
- **Comprehensive Topic Monitoring**: Better visibility into message queue performance and throughput
- **Producer-Consumer Relationships**: Clear mapping of data flow relationships between services through messaging systems
- **Queue Depth Analysis**: Monitor queue depths and identify potential bottlenecks in asynchronous processing
**Improved Flow Visualization:**
- **Directional Flow Mapping**: Enhanced visualization of data flow direction between topics, tables, and services
- **End-to-End Tracing**: Follow data flows from producers through topics to consumers with improved clarity
- **Performance Correlation**: Better correlation between data flow metrics and service performance impacts
These improvements provide deeper insights into how data moves through your systems, making it easier to identify bottlenecks
and performance issues in event-driven architectures.
#### Aggregated Pod-Level Metrics
Causely now provides enhanced pod-level observability with aggregated metrics that give you better insights into container performance:
**Enhanced Pod Visibility:**
- **Aggregated Resource Metrics**: Combined view of resource utilization across related pods
- **Node-Container Relationships**: Improved tracking of how containers relate to their host nodes
- **Performance Correlation**: Better correlation between individual pod performance and overall service health
- **Resource Optimization Insights**: Clearer understanding of resource usage patterns to inform optimization decisions
This enhancement provides more granular visibility into your containerized workloads while maintaining the broader service-level
context that's crucial for effective root cause analysis.
#### Location-Based Notification Routing
Organizations operating across multiple regions or locations can now route root cause notifications to different destinations based on where entities are located:
**Key Features:**
- **Geographic Routing**: Automatically route notifications based on entity location or region
- **Multi-Region Operations**: Support for organizations managing infrastructure across different states, countries, or data centers
- **Customizable Routing Rules**: Configure notification destinations based on entity labels, namespaces, or other location indicators
- **Operational Efficiency**: Ensure the right teams receive notifications for incidents in their operational domain
This capability is particularly valuable for organizations with distributed operations teams who need location-specific incident routing to
ensure fast response times and appropriate escalation paths.
#### Did you know?
Even without an active root cause, you can drill down into a service and get a list of **potential root causes** that could be impacting it, and a list of symptoms across
entities that could be indicative of those root causes. This enables you to assess risk and prioritize response efforts effectively.
#### Bug Fixes and Minor Improvements
This release includes numerous stability improvements and enhancements across the platform:
- **Database Performance**: Improved database headline scanning for better performance and reliability
- **Entity Management**: Enhanced handling of entity data request pathways with status tracking
- **Cloud SQL Stability**: Improvements to cloud-sql proxy for more stable database connections
- **Memory Management**: Enhanced memory noisy neighbor detection with additional condition checks
- **Notification System**: Improved notification routing per mediator for better distribution
- **Network Metrics**: Enhanced collection of basic network metrics for improved observability
- **Entity Relationships**: Better management of node-container relationships in the mediator
- **eBPF Instrumentation**: Upgraded to Beyla 2.5 for improved automatic instrumentation capabilities
- **Entity Configuration**: New database table and APIs for enhanced entity configuration management
- **Manifestation Handling**: Improved handling of manifestations for deleted entities
- **Redis Performance**: Enhanced Redis queue performance for better system responsiveness
---
## v1.0.92
### September 23, 2025
v1.0.92
#### Enhanced Ask Causely with Integration and Documentation Support
Ask Causely now provides intelligent assistance across two critical areas that significantly expand its utility:
**Integration Status Intelligence:**
- **Real-Time Integration Health**: Ask about the current state of your telemetry integrations and data sources
- **Configuration Validation**: Get insights into integration setup and troubleshooting guidance
- **Coverage Analysis**: Understand which parts of your infrastructure are being monitored and identify gaps
- **Performance Metrics**: Query integration performance, data ingestion rates, and connection health
**Documentation-Aware Assistance:**
- **Context-Aware Documentation**: Ask Causely can now answer questions directly from Causely's extensive documentation
- **Feature Guidance**: Get help understanding how to use specific Causely features and capabilities
- **Best Practice Recommendations**: Receive expert advice on configuration, setup, and optimization
- **Troubleshooting Support**: Access step-by-step guidance for common issues and advanced scenarios
This enhancement makes Ask Causely your comprehensive assistant for both operational troubleshooting and platform guidance, reducing context switching and accelerating problem resolution.
#### Enhanced Root Cause Management
Managing and analyzing root causes becomes more powerful with new filtering and historical analysis capabilities:
**Priority Filtering and Tagging:**
- **Priority-Based Filtering**: Filter root causes by priority levels to focus on the most critical issues
- **Tag-Based Organization**: Use custom tags for root causes for better categorization and filtering
- **Enhanced Search**: Quickly find specific root causes using tag and priority filters
**Historical Analysis:**
- **Custom Date Filters**: Analyze root causes across any custom date range for historical insights
- **Trend Analysis**: Identify patterns and recurring issues over time
- **Historical Context**: Better understand how root causes have evolved and been resolved
These capabilities help teams prioritize incident response and gain insights from historical patterns.
#### Mediation Insights: Understanding Your Causely Setup
Causely now provides comprehensive visibility into its own operations, giving you clear insights into how your Causely deployment is working and what it's discovering in your environment:
**See What Causely Knows About Your Environment:**
- **Discovered Entities Overview**: Get a clear picture of all the services, databases, load balancers, and infrastructure components that Causely has discovered
- **Discovery Progress**: Track which parts of your infrastructure Causely is actively monitoring and identify any gaps in coverage
- **Setup Validation**: Understand whether your Causely installation is working as expected and discovering the entities you expect it to find
- **Environment Coverage**: See the full scope of what Causely is monitoring across your entire system
**Monitor Causely's Health and Performance:**
- **Integration Status**: Check the health of all your configured data sources and integrations
- **Connection Monitoring**: See which external systems (monitoring tools, databases, cloud providers) Causely is successfully connecting to
- **Processing Performance**: Monitor how efficiently Causely is analyzing your telemetry data and generating insights
- **System Resource Usage**: Track Causely's own resource consumption and performance metrics
These self-insights gives you confidence that Causely is working correctly, helps you optimize your setup, and ensures you're getting comprehensive coverage of your infrastructure.
#### Enhanced eBPF Instrumentation with Beyla 2.6
Causely now leverages [**Grafana Beyla 2.6**](https://github.com/grafana/beyla/releases/tag/v2.6.0), bringing significant improvements to automatic instrumentation capabilities:
**New Beyla 2.6 Features:**
- **Improved MongoDB Instrumentation**: Enhanced support for MongoDB monitoring and trace collection
- **Advanced Service Discovery**: Better automatic discovery of services and applications
- **Enhanced OpenTelemetry Integration**: Improved compatibility with OpenTelemetry ecosystem components
- **Stability Improvements**: Various fixes and enhancements for more reliable instrumentation
**Enhanced Integration Capabilities:**
- **Configurable OpenTelemetry SDK**: More flexible configuration options for telemetry collection
- **Improved Metrics Collection**: Enhanced metrics gathering through OpenTelemetry protocols
- **Advanced Discovery Configuration**: Fine-tuned discovery settings for different deployment scenarios
This upgrade ensures that Causely's [automatic eBPF-based instrumentation](/telemetry-sources/ebpf) remains at the forefront of eBPF-based observability technology.
#### Did you know?
**Causely works with virtually any programming language** because it's built on OpenTelemetry, the industry-standard observability framework.
OpenTelemetry provides native instrumentation libraries for all major languages including:
- Java
- .NET
- Go
- Python
- JavaScript
- C++
- Rust
- PHP
- Ruby
- Swift
- Erlang/Elixir
- ... and many more.
Whether your applications are already instrumented with [OpenTelemetry](https://opentelemetry.io/) or you're just getting started, Causely can help:
- **Want to get started quickly?** Use Causely's [automatic eBPF-based instrumentation](/telemetry-sources/ebpf) for zero-code observability
- **Already using or rolling out OpenTelemetry?** Learn how to [integrate with OpenTelemetry](/telemetry-sources/opentelemetry) alongside your existing rollout
This flexibility means Causely can provide root cause analysis regardless of your technology stack or observability maturity.
#### Bug Fixes and Minor Improvements
This release includes numerous enhancements and fixes across the platform:
- **Incident.io Integration**: Added support for Incident.io auto-mapping and integration for enhanced workflow management
- **Improved Notification System**: Fixed notification ordering and enhanced support for multiple owner notifications
- **Enhanced Performance**: Resolved race conditions, improved queue processing, and better latency threshold calculations
- **Better Visualization**: Improved topology graphs with bidirectional edges and enhanced root cause naming for AWS ALB and GCP load balancers
---
## v1.0.96
### October 13, 2025
Version v1.0.96
#### Service Prioritization
Not all services are created equal. You can now set priorities for your services so notifications reflect what matters most.
Assign strict SLOs to critical services and reduce noise from lower-priority ones, helping teams focus where impact is highest.
#### incident.io Integration
[Causely integrates with incident.io](/workflows/incident-io) to automate incident response.
Causely analyzes alerts in real time, maps them onto live dependency graphs,
and pinpoints the single root cause behind cascading failures; incident.io
then routes the incident to the right team with full causal context,
reducing triage time and accelerating recovery.
#### Elastic Log Ingestion
For customers sending logs directly to Elasticsearch,
Causely can now ingest and analyze those logs. See log-based errors and
contributing signals alongside metrics and traces in your causal graph.
#### Instana Integration
Causely now supports [Instana](/telemetry-sources/instana) for trace, metric, and data-flow ingestion.
This enables teams using Instana to visualize dependencies, identify performance bottlenecks,
and detect root causes directly within Causely.
#### Early Access: Enhanced Root Cause Descriptions and Remediations
We've introduced an LLM-powered preview that enhances root cause descriptions and recommended remediations.
Causely synthesizes the most relevant context—symptoms, metrics, and logs—to produce clear, actionable explanations.
We'd love your feedback as we refine this capability.
#### Did you know?
Causely has a feature-rich API, that allows you to programmatically access and integrate with Causely's causal engine.
Learn more about the [Causely API](/api).
#### Bug Fixes and Minor Improvements
- Improved auto-mapping of Prometheus alerts defined for RabbitMQ
- Improved resource metric visualization for Nomad environments
- Improved Datadog integration to leverage OTel traces
- Improved handling of context in initial prompts and answer parsing for Ask Causely
---
## v1.0.99
### October 30, 2025
Version v1.0.99
#### Ask Causely: Logs and Events Access
When you ask about a service's health, Ask Causely now summarizes recent errors and warnings from container logs and relevant events.
This gives you faster context on what changed and where to look next.
#### Uptime SLO Added
Beyond response error rate and latency SLOs, uptime SLOs are now automatically configured for every discovered service.
Causely continuously learns baseline thresholds for request durations. You can customize SLOs and thresholds per service or
deprioritize services you don't want to operate under an SLO.
#### HTTP Path and RPC Method Mapping
You now have clear visibility into which services each HTTP path or RPC method belongs to.
When latency or error rates spike on a specific endpoint, immediately identify the underlying service for faster remediation.
#### Historical Root Causes Filter
Filter historical root causes by precise time windows to narrow your analysis and track behavior over specific periods.
#### Did you know?
We've partnered with Google Gemini to enhance Causely's AI SRE experience. Causely’s causal reasoning engine delivers deterministic diagnoses, while Gemini adds grounded summarization, entity recognition, and code generation to power Ask Causely and causal explanations/remediations. Read the blog: [How Causely and Google Gemini Are Powering Autonomous Reliability](https://www.causely.ai/blog/causely-and-google-gemini).
#### Bug Fixes and Minor Improvements
- Updated Beyla agent to address incorrect service graph rendering in the Causely UI.
- Loki logs display fix: timestamps now correctly show the original date and time of each message.
---
## v1.0.143
### Business KPI detection
Causely now detects drops in business KPIs and explains them, starting with concurrent users on a Business Application. Before, Causely could tell you a service was failing but not that users were being locked out of the application. Now a Concurrent Users Drop Signal fires when a Business Application's concurrent users fall below their lower threshold, and Causely traces the drop to a diagnosis on one of its member services. This connects technical problems to business impact.
You do not need to set the threshold or rely on an external alert. Causely learns a lower threshold from each application's own history, using the last day of data and building on stored daily history as it accumulates. If you already know the right threshold, you can map your own and Causely uses it instead.
Several existing diagnoses now explain user loss, including throttling, rate limiting, NGINX worker connection exhaustion, unavailable HAProxy backends, and load balancer misconfiguration. A new Client Connection Disruption diagnosis covers the case where existing client connections are dropped, for example by a load balancer or proxy change, and users then flood back in to reconnect. Causely recognizes that pattern from a new Request Burst Signal on HTTP paths and RPC methods, which fires when an endpoint's request rate climbs well above its recent average.
To get started, review the your services grouped into a Business Application and map its concurrent users metric through Prometheus.
[Learn more](/configuration/business-kpis/)
### Snapshot tools in MCP
Agents can now create, list, compare, and delete environment snapshots through the Causely MCP server, using `create_snapshot`, `get_snapshots`, `compare_snapshots`, and `delete_snapshot`. Before, snapshots were only available in the Causely portal. A snapshot captures topology, active diagnoses, and resource and service metrics over a window of up to two hours. Comparing a baseline snapshot with a later one returns an ACCEPTED or REJECTED assessment, along with added and removed entities, new and cleared diagnoses, and before and after CPU, memory, request rate, error rate, and duration. This lets a CI/CD pipeline or an agent decide whether a change caused a regression. Creating and deleting snapshots requires the Developer or Admin role.
[Learn more](/in-action/reliability-delta/#using-snapshots-through-mcp)
### Topology discovery from Datadog and Observe
Causely can now build topology from Datadog and Observe without installing Causely in your monitored clusters. For Datadog, Causely discovers Kubernetes entities, hosts, and APM services with their HTTP routes and RPC methods through the Datadog API. For Observe, Causely discovers Kubernetes entities and APM topology through the Observe API. In both cases, clusters already monitored by a Causely agent keep the agent's view. Teams that send their telemetry to these platforms get Causely's causal analysis from the data they already collect.
[Learn more about Datadog](/telemetry-sources/datadog/#discover-infrastructure-and-application-services-from-the-datadog-api) · [Learn more about Observe](/telemetry-sources/observe/)
### Export Issues and Diagnoses to Observe
Causely now sends Issues and Diagnose to Observe, so Observe's AI SRE can answer reliability questions from causes Causely has already identified. Before, the AI SRE had to work out the cause of a problem from raw telemetry on its own. Now it can start from the diagnosis behind each Issue, which makes its answers more consistent and helps users resolve problems faster. Observe is the first destination for Causely's new export framework and this capability is currently only supported for Causely BYOC deployments.
[Learn more](/workflows/observe/)
### Minor Improvements
- **Onboarding:** Invited users now follow a single onboarding flow: install, connect, verify data, and ask a first question through MCP.
- **Name resolution in MCP:** `name_lookup` now matches partial cluster and namespace names, so "robot" finds `robot-shop`. A new `service_types` filter tells apart services that share a name in the same cluster and namespace, such as a Deployment and a CronJob.
- **MCP tool guidance:** Tool descriptions and prompts now tell agents to scope service lookups by cluster and namespace. This stops agents from resolving to the wrong service when names repeat. Agents are also prompted to report feedback with `submit_feedback` after reviewing an Issue or diagnosis.
- **Faster throttling detection:** Request throttling on an HTTP path now activates after 5 minutes instead of 10, so short throttling incidents at the edge are caught while they are still happening.
- **Entity sorting in the API:** The GraphQL entities connection can now sort entities by number of dependents or dependencies.
- **Backstage alert mapping:** Alerts that carry only a Backstage component label are now mapped to the related Kubernetes service on a best-effort basis.
- **GCP Hyperdisk limits:** Disk limits now cover N4A and N4D VM types.
- **Scheduling diagnosis on unhealthy nodes:** Taints that Kubernetes or a cloud provider sets on unhealthy nodes, such as `not-ready` or `unreachable`, no longer produce a false "missing toleration" diagnosis on the workload.
- **Initial sync for discovered accounts:** Accounts discovered from Kubernetes secrets are now included in the mediator's startup sync, and failed initialization is retried. Before, these accounts could wait a full sync interval for their first data.
---
## v1.0.109
### January 12, 2026
Version v1.0.109
#### Expanded Causal Model for Asynchronous Communications
Causely's causal model has been expanded to better represent asynchronous messaging systems by adding support
for **queue size growth** and **dead-letter queue** symptoms. For the underlying failure mode and why it gets misdiagnosed,
see [Queue Growth, Dead-Letter Queues, and Why Asynchronous Failures Are Easy to Misread](https://www.causely.ai/blog/queue-growth-dead-letter-queues-and-why-asynchronous-failures-are-easy-to-misread)
This allows Causely to more precisely diagnose reliability failures where message brokers accept traffic,
but downstream consumers are unable to process messages reliably or quickly enough, leading to
sustained backlogs, processing failures, and degraded system behavior. Teams can now pinpoint where
asynchronous workflows are breaking down, instead of inferring issues indirectly from latency or error spikes elsewhere in the system, enabling faster and more confident remediation.
#### Managed Notifications
You can now set up and manage alerting workflows directly from the Causely UI. This removes the need for manual configuration and makes it significantly easier to control how root causes inferred by Causely are routed to your teams.
Notifications can be sent to **Slack, Microsoft Teams, Alertmanager, incident.io, and Splunk On-Call**, with flexible filtering that lets you distinguish urgent versus non-urgent issues, by root cause type (for example, application versus infrastructure root causes), and where an issue originates (for example, by cluster or namespace).
By embedding Causely root cause notifications into on-call workflows, teams gain tighter control over alert noise and escalation paths, ensuring that high-impact root causes reach the right responders with the right context, while lower-priority signals no longer interrupt on-call unnecessarily.
[Learn more](/workflows/ui-notifications/).
#### UI Support for Threshold Configuration
Causely now supports configuring latency and error rate thresholds directly in the UI for individual services. This allows you to override learned thresholds when you have explicit knowledge of expected service behavior or contractual service levels.
By aligning thresholds with how a service is actually operated and measured, the symptoms feeding Causely's causal model more accurately reflect reliability expectations. Better-aligned thresholds improve the relevance and credibility of detected symptoms and downstream root causes, reducing false positives while preserving sensitivity where it matters most.
[Learn more](/configuration/thresholds/#using-the-causely-ui).
#### Minor Improvements
- Improved performance and reliability when creating snapshots used to calculate reliability deltas
- Enhanced CockroachDB support by mapping database metrics to the underlying EC2 instances
- Added richer attribute details for select integrations (for example, OpenTelemetry) to improve understanding of the status of the integration
---
## v1.0.110
### January 26, 2026
Version v1.0.110
#### Ask Causely: Natural Language on Logs and Alerts
Ask Causely can now answer follow-up questions about logs associated with a specific root cause.
Causely already infers the true root cause using its causal model and automatically correlates relevant errors and warnings from the affected services or containers.
With this update, you can dig deeper by asking targeted questions to filter and retrieve specific logs, such as:
- _"Can you show me all the error level logs associated with this root cause?"_
- _"Can you show me the logs related to Kafka on this root cause?"_
Ask Causely also better understands alerts. If you paste an alert from Prometheus or Datadog, it can identify the underlying root cause or determine that the alert is spurious,
with clear evidence so you don't waste time investigating noise.
#### Minimum Threshold for Learned Latency
You can now [configure a minimum value](/configuration/thresholds/#using-the-causely-ui) for Causely's learned latency (request duration) thresholds.
By default, thresholds are learned from the p95 request duration over the last 24 hours, which can become too sensitive in low-traffic scenarios.
The minimum threshold prevents unnecessary noise, for example when traffic dips over the weekend and spikes on Monday.
This can be configured for services via the UI, and for HTTP paths or RPC methods via the API.
#### Prioritizing Dataflows with SLOs (API-only)
You can now assign SLOs to specific HTTP paths or RPC methods to prioritize critical user flows. This is currently configurable through the [API](/api/queries/setting-slos-on-paths-and-methods/).
When an SLO is at risk or violated, any root causes affecting that endpoint or its upstream dependencies are automatically treated as urgent.
This helps teams focus on issues that directly impact key business journeys, such as checkout.
#### Minor Improvements
- [Improved Kubernetes API caching](/installation/customize/#installing-in-a-large-kubernetes-cluster-1000-nodes) to support clusters with thousands of nodes while reducing API load
- [Added support](/installation/customize/#connecting-to-a-remote-kubernetes-cluster) for connecting to remote Kubernetes clusters for service discovery without deploying a mediator in every cluster
- Improved OpenTelemetry trace support in standalone Docker environments so traces connect correctly to relevant entities
- Removed scope constraints when defining notification filters for more flexible alert routing
---
## v1.0.114
### February 5, 2026
Version v1.0.114
#### Alert Mapping and Root Cause Context
We've enhanced support for ingesting alerts from [Alertmanager](/telemetry-sources/alertmanager), [Prometheus](/telemetry-sources/prometheus), [Mimir](/telemetry-sources/prometheus/#multi-tenant-mimir), [incident.io](/telemetry-sources/incident-io), and [Datadog](/telemetry-sources/datadog) to make it easier to understand the actual root cause behind alert noise.
Ingested alerts are now explicitly mapped to symptoms and shown in the context of the inferred root cause. This reduces the toil of chasing individual alerts and helps teams focus on resolving the underlying issue instead of investigating symptoms in isolation.
You can also view alerts over time and see which symptoms and root causes they mapped to, making it easier to understand alert behavior patterns and their real impact.
_Alerts are mapped to symptoms and shown in the context of the inferred root cause, so you can see which underlying issue each alert points to._
_A more complete view of which alerts mapped and which did not gives you confidence that Causely understands what's important to you (or not)._
#### Google Cloud Pub/Sub
We’ve expanded support for asynchronous dataflows to include [Google Cloud Pub/Sub](/telemetry-sources/gcp#overview).
Cloud Pub/Sub is now modeled as a first-class asynchronous service type, allowing teams to understand how message-driven workflows contribute to incidents and root causes without stitching together dashboards or relying on black-box summaries.
#### Minor Updates
- [Credential auto-discovery for PostgreSQL](/telemetry-sources/postgresql/#alternative-enable-credentials-autodiscovery)
- Improved [AWS](/telemetry-sources/aws) SQS queue discovery
- Ensured queues and exchanges are visible within a [defined scope](/configuration/scopes)
- Improved how dataflow graphs are rendered for queues
- Added support for [GCP authentication using Workload Identity Federation for GKE](/telemetry-sources/gcp#option-b-gke-workload-identity-federation-recommended)
---
## v1.0.116
### February 19, 2026
Version v1.0.116
#### Expanded Alert Mapping Support (HTTP Paths, Kafka Topics, JVMs)
Causely now supports [alert mapping](/reference/symptoms) for:
- **HTTP Paths**
- **Kafka Topics**
- **JVMs**
This enhances Causely's ability to ingest and interpret alerts from systems such as [Alertmanager](/telemetry-sources/alertmanager),
[Mimir](/telemetry-sources/prometheus/#multi-tenant-mimir), [Datadog](/telemetry-sources/datadog), and others.
Mapped alerts are incorporated as [symptoms](/reference/symptoms) in the causal model, allowing Causely to leverage the signals you already
trust and use them as structured inputs into deterministic root cause analysis.
#### Improved Asynchronous Dataflow Understanding
We've enhanced the [dataflow graph](/in-action/topology#dataflow-map) to provide a more complete view of asynchronous interactions.
Previously, the graph showed only queue publishers (e.g., RPC methods, service tasks, background operations). It now reflects the full lifecycle of a queue, including:
- Operations that consume from the queue
- Upstream and downstream services, RPC methods, or HTTP which are part of the flow
- End-to-end propagation across asynchronous boundaries
This provides a more accurate system-level view of cause and effect across distributed workflows, especially where queues introduce delayed or indirect impact.
_The Dataflow Map tab now shows the full queue lifecycle—publishers, the queue itself (e.g. on Redis), and consumers—so you can trace cause and effect across asynchronous boundaries._
#### SLOs for Queues (API)
You can now assign [SLOs](/configuration/slo-configuration) to specific queues that support critical product and user flows. This is currently configurable via the [API](/api/queries/setting-slos-on-paths-and-methods/).
When a queue SLO is at risk or violated, any root causes affecting that queue or its upstream dependencies are automatically elevated as urgent. This ensures teams prioritize issues that directly impact key business workflows.
**Example:** If you need to ensure that an order-processing queue is drained within a defined time window, you can define an SLO using Queue Depth (or a related metric) as the SLI.
Causely will then treat violations or burn risks as high priority and surface the most relevant causal explanations with an **Urgent** severity.
#### Minor Improvements
- **OpenTelemetry integration health:** Prevent Causely-generated entities from being re-reported via [OpenTelemetry](/telemetry-sources/opentelemetry)
- **Copilot improvements:** Improved answer quality when asking questions about Causely [documentation](/getting-started/how-causely-works) in Ask Causely
- **Snapshot selection:** Improved visibility and selection of snapshots for [Reliability Delta](/in-action/reliability-delta) workflows
- **Entity root cause history:** Active and historical root causes are now shown directly on the [entity view](/in-action/topology#diagnoses) (for example a service or RPC method)
---
## v1.0.118
### March 3, 2026
Version v1.0.118
#### ClickHouse Support
Causely now supports **ClickHouse** as a telemetry source.
When ClickHouse is a critical component of your distributed system, this integration allows Causely to detect and surface issues in ClickHouse that may impact client services or overall application performance.
With ClickHouse telemetry integrated into the causal model, Causely can:
- Identify when ClickHouse is the **root cause of service degradation**, such as query latency, resource contention, or node issues
- Show which **services and user-facing flows are affected** when ClickHouse performance degrades
- Distinguish **cause from symptom**, helping teams determine whether an issue originates in ClickHouse or another service
[**Learn more**](/telemetry-sources/clickhouse/)
#### Splunk Integration
Causely can now automatically surface **error and warning logs from Splunk**.
When Causely infers a root cause in your distributed application, relevant Splunk log entries are surfaced alongside the root cause.
Causely also reviews Kubernetes pod and container logs, surfacing any error or warning messages observed within the previous 24 hours to help engineers quickly understand what changed or failed around the time of the incident.
[**View setup guide**](/telemetry-sources/splunk/)
#### Beyla 3.0 Support
Causely now supports **Beyla 3.0**, enabling expanded auto-instrumentation capabilities.
This release improves visibility into encrypted communication between Java services and common data infrastructure components, including:
- Kafka
- PostgreSQL
- CockroachDB
This allows Causely to observe and model interactions that were previously difficult to capture due to encrypted connections. This additional auto-instrumentation is **not** enabled by default.
#### Minor Improvements
- **Improved Alert Mapping**: Expanded the types of alerts that automatically map to entities and symptoms, improving the accuracy and usefulness of root cause analysis.
- **Extended Alert History**: Alert history retention has been extended to 24 hours, allowing teams to review which alerts fired and understand the root causes associated with them.
- **Improved Alert History View**: The Alert History view now deduplicates alerts that fire repeatedly over the same time window. This makes it easier to understand alert frequency and recurring patterns.
- **Alert Search and Filtering**: Improved search and filtering capabilities within the alert history view, including searching by alert name and filtering by alert state (for example firing or pending).
- **Dataflow Graph Improvements**: Improvements to the dataflow graph make it easier to understand data movement across services, particularly in environments with multiple hops or complex service chains.
---
## v1.0.122
### March 20, 2026
Version v1.0.122
#### Dynatrace Improvements
- **Expanded alert ingestion and causal mapping**
Causely now automatically ingests alerts defined in Dynatrace and maps them to discovered entities and symptoms in the causal model. When a mapped alert is firing, it is incorporated into causal analysis to identify the underlying issue—helping teams focus on the cause rather than system-level noise.
- **Support for ECS-based applications via Dynatrace**
Expanded support for applications running on ECS using Dynatrace OneAgent / APM instrumentation. This enables end-to-end reliability management across distributed systems spanning both Kubernetes and ECS environments.
[**Learn more**](/telemetry-sources/dynatrace/)
#### Backstage Integration
- **Enriched topology with ownership and metadata**
Causely now integrates with Backstage, enriching the system topology with team ownership and component metadata (type, lifecycle, system).
- **Faster triage with clear ownership context**
For teams using Backstage as the system of record, Causely surfaces who owns the service or component involved in an issue—reducing time to identify the right team during incidents.
[**Learn more**](/telemetry-sources/backstage/)
#### Expanded Alert Mapping to Entities
- **Broader alert coverage beyond modeled symptoms**
Alerts can now be mapped to entities even when they do not correspond to an existing symptom in the causal model.
- **Consistent deduplication across all alerts**
The same deduplication logic is applied, reducing noise and improving signal quality.
- **Improved visibility into model gaps**
This makes it easier to identify high-frequency or critical alerts that should be incorporated into the causal model, helping continuously improve coverage and root cause accuracy.
#### Minor Improvements
- Improved Ask Causely behavior when determining relevant entities based on current scope
- Enhanced SLO views to better communicate remaining error budget
- Fixed an issue in the Slack app when identifying root cause from alerts
- Availability SLOs are now evaluated even when no traffic is observed
---
## v1.0.123
### March 31, 2026
Version v1.0.123
#### MCP Enhancements
The Causely MCP server has been significantly expanded, now including 24 tools, 9 predefined prompts, and 4 resources, giving AI agents and automation workflows structured access to Causely's causal intelligence layer.
**New workflows: triage, team health, and post-mortem**: Agents can now invoke causal triage directly, retrieving root cause, blast radius, and service ownership without querying raw telemetry. Team health summaries and post-mortem generation are also available as first-class MCP workflows, reducing the manual overhead of incident documentation.
**Structured data and log access**: MCP-connected agents can retrieve entity data and logs through Causely, with PII filtering applied automatically, giving agents the signals they need while keeping sensitive data out of AI context windows.
[**Learn more**](/agent-integration/)
#### Azure Redis Enterprise Support
Causely now discovers and monitors Azure Redis Enterprise instances, extending causal coverage to this commonly used caching layer. Redis health and dependency relationships are incorporated into the causal model alongside other infrastructure and service components.
[**Learn more**](/telemetry-sources/azure/)
#### Improved Notification Configuration
You can now configure how Causely processes notifications across your environment. Notifications can be processed either globally (one cluster that manages notification rules for all clusters) or per-cluster (independent notification processing per cluster).
[**Learn more**](/workflows/ui-notifications/)
#### Minor Improvements
- Idle service detection added via API, making it easier to identify services that should be removed from an environment
- Fixed threshold confusion in symptom display, thresholds now reflect the correct learned baseline context
- Loki integration now supports basic auth
- Kafka API updated to v1 for improved compatibility
- Dynatrace service discovery now runs in parallel, reducing graph build time
- Beyla updated to 3.1.2
---
## v1.0.125
## Release Notes — v1.0.125
Version v1.0.125
### Expanded MCP Coverage
The Causely MCP server adds five new tools and six new prompts, giving AI agents and automation workflows a broader set of operational capabilities without requiring custom context engineering.
New tools cover structured health summaries for any entity or full environment (`get_entity_health`, `get_environment_health`), integration status visibility (`get_integration_status`), label enumeration for filtering and search (`get_label_values`), and structured incident ticket generation (`generate_ticket`). Agents can now answer a wider range of operational questions, from environment-wide health snapshots to integration coverage gaps, using structured, causal-grounded outputs rather than raw telemetry.
New prompts cover error rate ranking across services, resource usage leadership, data asset consumer mapping, historical incident windows, external alert mapping to Causely's causal model, and database-focused investigation workflows. These give agents and users pre-built starting points for the most common observability and reliability queries.
[Learn more](/agent-integration/mcp-server/)
### Expanded Root Cause Coverage
Causely now detects and models additional root causes across Postgres, Redis, MongoDB, Kafka, and Kubernetes Node infrastructure, reducing the gap between where symptoms surface and where the actual cause lives.
Without these models, agents and on-call engineers must manually correlate infrastructure signals to application degradation. With them, Causely can identify the true origin of an incident, connection pool exhaustion, replication lag, storage pressure, and suppress downstream symptoms that would otherwise generate noise.
- **Postgres**: Cache hit rate degradation, checkpoint I/O pressure, connection slot exhaustion, deadlock storms, idle-in-transaction accumulation, lock contention, replication lag, and query memory spill to disk.
- **Redis**: Cache miss storms, command queue saturation, memory pressure, and connection exhaustion.
- **MongoDB**: Connection exhaustion, cursor pressure, and replica lag.
- **Kafka**: Partition outages, replication degradation, and storage pressure.
- **Kubernetes Node**: Causely Agent down detection, with root cause attribution across container runtime, filesystem, kernel, Kubelet, network, PID pressure, and malfunction conditions.
*Example troubleshooting queries using Claude and Causely MCP*
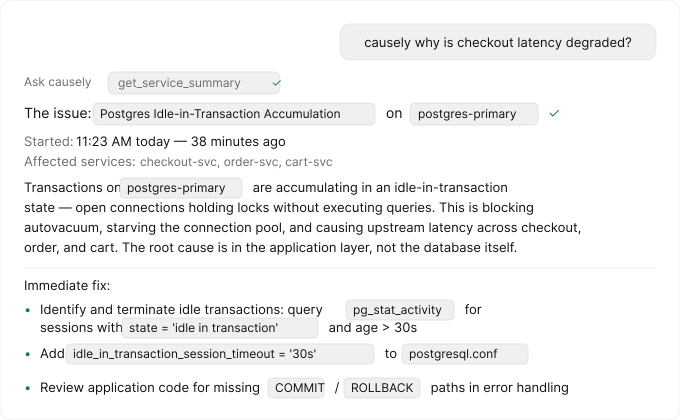
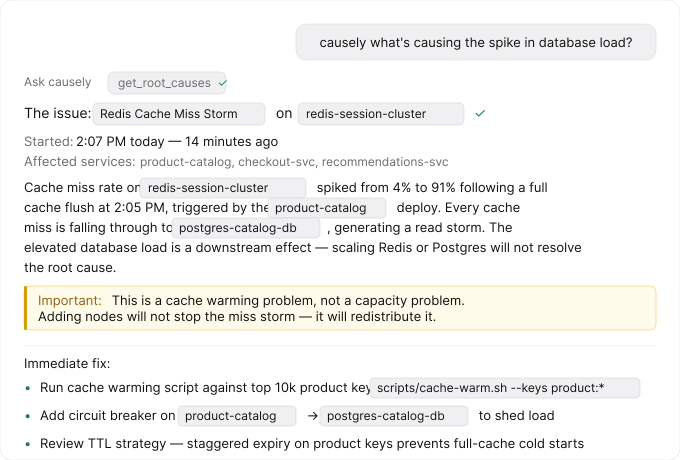
### Log-Based Application Root Cause Detection
Causely now monitors application logs continuously and activates symptoms based on defined error patterns, extending causal analysis to common application-level failure modes.
Causely already captures and surfaces container logs alongside detected symptoms and root causes. These new root causes go further, continuously monitoring those logs for defined error patterns and feeding matching signals directly into Causely's causal analysis, so application-level failures are identified as named root causes rather than requiring manual log inspection to interpret.
This new capability adds **25 new application root causes** spanning Java, Python, Go, and .NET runtimes, web and proxy layers (Nginx, HAProxy), and data systems (Cassandra, Elasticsearch, MySQL, RabbitMQ).
[Learn more](/reference/root-causes/)
### Minor Improvements
- **MCP authentication:** Static OAuth credential support added so long-running background agents no longer need to re-authenticate via bearer token. [Learn more](/agent-integration/mcp-server/#authentication)
- **AWS ECS log retrieval:** Agents and workflows can now retrieve logs from ECS containers.
- **Operator update control:** Automated update behavior is now configurable per cluster. [Learn more](/installation/operator#when-to-use-the-operator)
- **Dynatrace management zones:** Causely now discovers Dynatrace management zones and applies corresponding labels for search and filtering.
- **Dynatrace alert polling:** Increased monitoring frequency for faster detection of Dynatrace alert state changes.
- **Notification payload:** Expanded payload content for Causely alert notifications.
- **Scope and topology filtering:** Improved accuracy and coverage of scope and topology filters.
- **Beyla 3.7.0:** Updated to Beyla 3.7.0, improving trace fidelity for encrypted Java and Kafka communications.
---
## v1.0.126
## Release Notes — v1.0.126
### Generic Application Error Log Detection
Causely now detects generic application errors in logs and incorporates them into the causal model via a new Application Error Spike symptom and root cause. Previously, log-based root cause detection relied on predefined error patterns; errors that did not match a known pattern were not surfaced. When Causely observes more than 2,000 generic errors within a one-hour window, it activates the application error log symptom, which is then used in continuous root cause analysis to help agents and on-call engineers identify and resolve the underlying issue faster. Note that the threshold for error log symptom activation is configurable, see more detail in [threshold configuration](/configuration/thresholds/).
[Learn more about log-based root causes](/reference/root-causes/?sources=Logs)
### Token Management and Developer Role
Causely now supports rotating and revoking the tokens used with the Causely mediator, and introduces a new Developer role. Developers can add new mediators and manage tokens for those mediators; Administrator roles retain the ability to manage tokens across all mediators in a tenant. Read Only users cannot add mediators or manage tokens.
### Minor Improvements
- **AWS RDS database cluster support:** Causely now identifies both the overall RDS cluster and its individual databases, improving visibility into database-layer root causes.
- **Symptom activation timing:** Improved the symptom activation delay logic to better distinguish bursty anomalies from sustained ones. [Learn more](/configuration/symptom-delay/)
- **Generic webhook notifications:** Improved support for sending Causely notifications to generic webhooks. [Learn more](/workflows/custom-workflows/)
- **Agent-not-deployed false positives:** Addressed incorrect "Causely agent is down" symptom activation for nodes where an agent was intentionally not deployed.
- **Elasticsearch integration:** Addressed an issue affecting the Elasticsearch integration.
- **Service logs tab:** Clarified that errors and warnings shown in the Service logs tab reflect the last 5 minutes of activity.
- **Node malfunction detection:** Improved detection of the node malfunction root cause to correctly handle scenarios where nodes are automatically removed by autoscaling mechanisms.
---
## v1.0.127
## Release Notes — v1.0.127
### Redesigned Mediators Page
The Mediators page has been redesigned with two additions that give teams more visibility and control over their mediator deployments.
**Release notes link:** When a new mediator version is available, a Release Notes link now appears directly on the page. Previously, the version update notification provided no context about what changed, requiring users to look up release notes separately. The link surfaces that context in place, so teams can assess whether an update is urgent without leaving the product.
**Operator status:** The page now surfaces whether the Causely Operator is installed for each cluster. When no operator is detected, a notice indicates that manual update is required and links to operator installation instructions. When the operator is installed, version updates can be triggered directly from the UI without a manual Helm upgrade. [Learn more about the Causely Operator](https://docs.causely.ai/installation/operator/)
### Streamlined Mediator Setup
Adding a new mediator now walks you through cluster naming and token generation in a single, consolidated flow. The installation command is available to copy directly from the setup screen, removing the need to navigate between steps to gather the information needed to complete an installation. The mediator token is displayed once during setup, at the point where it is needed.
### Minor Improvements
- **RabbitMQ MassTransit traces:** Causely now parses RabbitMQ MassTransit trace data, extending trace coverage for environments that use MassTransit as a messaging framework over RabbitMQ.
- **Topology search:** Fixed a bug where the filter search bar disappeared after returning results in the topology view. The search bar now persists after a search, and results can be cleared to return to the default state.
- **Log volume limits for root causes:** Log collection per root cause is now capped at 500 lines per service and 2,000 lines per defect. This prevents evidence sets from growing to 10,000+ lines and keeps root cause data focused and fast to load.
- **Docker service instance cleanup:** For Docker installations, stale service instance ID labels left behind after a process ID change are now removed automatically. This prevents topology noise from accumulating in Docker-based environments.
---
## v1.0.128
## Release Notes — v1.0.128
### Alert-Driven Root Cause Urgency
Causely now sets root cause urgency based on the severity and volume of the alerts it explains. Previously, root cause severity was independent of alert severity, requiring engineers to manually cross-reference alert priority against active root causes to understand what demanded immediate attention. Root causes now inherit the highest severity from the alerts they explain: a root cause linked to a High or Critical alert is automatically marked urgent. Root causes that explain five or more alerts are also marked urgent regardless of individual alert severity, ensuring that broad-impact failures surface at the top of the queue.
### MCP Skills and Tool Improvements
Causely now ships seven pre-built skills that package tools into structured investigation flows for use with Claude, Cursor, and other agents that support skills. Previously, agents had to chain raw tool calls manually, which required more tokens, more steps, and more prompt engineering to reach a reliable answer. The new skills cover common investigation patterns end to end, including alert investigation, entity health, and root cause retrieval, and are available out of the box with no additional configuration.
Several underlying tools have also been improved. Entity name lookup is now centralized, enabling agents to look up namespaces and clusters in addition to entities from a single tool, reducing the back-and-forth an agent previously needed to identify the right target. Alert investigation output is streamlined to surface cause context immediately. Entity health output is standardized across observation types, so agents receive consistent structure regardless of the signal source. Root cause retrieval has been expanded: queries about a pod now also surface active root causes on related controllers and containers, so agents are no longer limited to the exact entity named in the query. Causely also now provides richer detail on how a root cause was identified, enabling agents to clearly explain the causal reasoning behind each finding.
[Lean More](/agent-integration/mcp-server/skills/)
### Minor Improvements
- **Log evidence:** Causely now collects and displays one hour of warning-level and above log events per entity. This gives engineers and agents a consistent evidence window for any entity showing symptoms, without requiring a separate log query.
- **Trace handling:** Improved mediator handling of large trace volumes, reducing processing pressure in high-throughput environments.
- **AWS ElastiCache Redis:** Optional IAM authentication is now supported, allowing teams that have IAM-based access controls on ElastiCache to connect without storing static credentials.
- **Remediation language:** Suggested remediations now clarify that recommendations are based on runtime observations. The updated language makes explicit that access to configuration, code, or runbooks would allow Causely to provide more precise guidance, setting more accurate expectations for automated and human-reviewed remediation workflows.
---
## v1.0.130
## Release Notes — v1.0.130
### Gen AI Application Monitoring
Causely now models Gen AI applications as first-class entities, giving you visibility into how your services interact with LLMs and how data flows through those interactions. You can see which HTTP paths or RPC methods on which service are calling which models, track inference duration, error rates, and token throughput per model, and understand degradation in AI-powered features the same way you would any other service. This release also extends the Causal Model with two new root causes, [AI Model Congestion and AI Model Malfunction](/reference/root-causes/?category=Service&subcategory=AI+Model), enabling deterministic diagnosis of Gen AI performance issues without manual investigation.
[Learn more about managing Gen AI applications](https://www.causely.ai/blog/why-genai-applications-are-hard-to-operate)
### MCP Server Updates
This release expands what agents can do with the Causely MCP server: a new impact-analysis tool, faster core queries, and wider environment coverage.
- **`get_incident_impact`:** Replaces the `triage` tool. Returns the downstream impact and blast radius of an active root cause, giving agents and on-call engineers a clearer starting point for prioritization.
- **`get_symptoms`:** Improved anomaly capture so agents surface a more complete picture of environment state during triage.
- **Performance:** Improved response speed for `get_entity_health` and `get_service_summary`.
Ask Causely has been removed from the UI. Connecting agents such as Claude Code or Cursor directly to the Causely MCP delivers faster, more accurate answers, without a separate portal.
[Learn more about the Cursor plugin integration](https://www.causely.ai/blog/a-cursor-plugin-for-ai-ops-agents-you-can-trust-in-production)
### Minor Improvements
- **Istio integration:** Expanded autodiscovery support reduces manual configuration for Istio-instrumented environments.
- **Metrics visibility:** Entity and service views now show only metrics with active data collection, reducing noise in low-coverage environments.
- **Log scanning:** Improved support for larger environments with higher log volume.
---
## v1.0.131
## Release Notes — v1.0.131
### Pyrra SLO Support
Causely now brings externally defined SLOs from [Pyrra](https://github.com/pyrra-dev/pyrra) into the product as first-class signals. Previously, teams that defined service and business objectives in Pyrra had to monitor SLO health in one place and investigate root causes in another, with no connection between the two. Causely now discovers Pyrra `ServiceLevelObjective` definitions automatically — from both the Pyrra CRD and PrometheusRule-based deployments — and binds each SLO to the correct service in the Causely topology.
Once discovered, SLO health, including error budget and burn rate, is visible on the associated service in both the UI and the MCP server. SLOs can also be surfaced on Business Applications: when a Pyrra SLO carries a Backstage component label, Causely attaches it to the corresponding Business Application discovered from Backstage, lifting SLO risk from the service level to the business level. Because SLOs are tied into the causal model, root cause analysis can now explain why an SLO is at risk or violated, tracing business impact down to the contributing service and infrastructure causes.
### MCP Server Updates
The `get_metrics` tool now accepts an `aggregate` parameter supporting 10 operations: `mean`, `sum`, `min`, `max`, `latest`, `first`, `p95`, `count`, `delta`, and `pct_change`. When set, the tool reduces a full time-series down to a single scalar value, eliminating the need for client-side computation. Agents can request an aggregate directly instead of retrieving raw series and computing summaries themselves, which reduces output size, token usage, and the number of steps needed to answer questions about metric behavior. The tool also now covers metrics for Gen AI and agentic workloads.
### Minor Improvements
- **Kubernetes discovery performance:** Improved initial discovery time for the Kubernetes controller in large clusters, reducing initial full sync from many minutes to a fraction of the time. Agents also now tolerate slow informer startup, waiting up to 30 minutes for node information before failing, which prevents spurious agent restarts during discovery in large environments.
- **Entity cleanup:** Fixed a bug where stale entities were not garbage-collected in the mediator. Entities that are no longer observed are now cleaned up correctly.
---
## v1.0.132
## Release Notes — v1.0.132
### Expanding the Causal Model
Causely now lets engineers add custom cause definitions to the [causality graph](/reference/terminology/#causality-graph-cg), extending the model to cover failure modes outside Causely's built-in diagnoses. Previously, alerts not tied to the built-in model were discarded: the failure modes they represented could not participate in causal reasoning and never surfaced as root causes, regardless of how often they occurred. A custom cause definition is not a relabeled alert: it becomes a node in the causality graph, enters the [codebook](/reference/terminology/#codebook), and is evaluated alongside built-in causes as symptoms propagate through the [topology](/reference/terminology/#topology).
Definitions can be created from the **Integrations → Alerts** view and managed under **Settings → User Defined Causes**; alerts without entity mapping will display a clear prompt indicating what configuration is required.
[Learn more](/configuration/custom-causes/)
### Expanded MCP Tools
Causely MCP now includes five new tools for exploring blast radius and the causal model in depth: what could cause a given signal, what signals a diagnosis would produce, what alternative diagnoses exist for an entity, and which entities have the most dependencies. Before this release, agents could retrieve active diagnoses but had no way to explore why a root cause was selected, what else could explain a symptom, or how far a failure would propagate. These tools close that gap, enabling agents to explain their conclusions and surface causal context that previously required manual investigation. The new tools are `get_potential_diagnoses`, `get_potential_observable_signals`, `get_signal_potential_diagnoses`, `get_diagnosis_observable_signals`, and `rank_entities`.
[Learn more](/agent-integration/mcp-server/)
### BYOC and Installation Customization
Causely now supports SSO and role-based access control through any OpenID-compatible identity provider, and allows teams to configure which AI model generates root cause summaries and remediation suggestions.
For Bring Your Own Cloud (BYOC) deployments, this removes a common blocker: enterprise environments that require integration with an existing identity provider or need to control which AI model is used due to compliance or cost policies can now configure both directly.
This release also expands infrastructure flexibility: the mediator now supports a managed Prometheus backend in place of the built-in VictoriaMetrics, and can be deployed outside Kubernetes in environments such as ECS clusters.
### Minor Improvements
- **Notification filtering by entity:** Root causes affecting a specific service can now be routed to a dedicated Slack channel, enabling more precise alert ownership and on-call routing.
- **Symptom history:** Historical symptoms that have since resolved are now visible in the UI and queryable via agent, for example asking whether a specific endpoint had elevated error rates in the last 24 hours.
- **Simplified notification setup:** Generic webhook notifications no longer require configuring the Causely Bot, reducing setup steps for new integrations.
- **Kubernetes alert mapping:** Kubernetes alerts are now mapped more accurately to Causely symptoms, making it easier to understand the root cause of infrastructure-level alerts.
- **Beyla updated to 3.20.0:** Improves parsing of GenAI-related telemetry.
- **Refined alert state categories:** Clearer distinction between alerts unmapped due to missing entity labels and alerts for entities not yet present in the discovered topology. [Learn more about alert mapping.](/configuration/alert-ingestion/)
- **Slack thread notifications:** Slack notifications now support a shorter initial message with full detail in the associated thread, reducing channel noise without losing context. [Learn more](/workflows/slack/#option-b-bot-token--channel-threaded)
- **Root cause log annotations:** Log entries associated with a root cause are now more precisely selected and annotated, improving the relevance of information used in suggested remediations.
---
## v1.0.133
## Release Notes — v1.0.133
### New MCP tool
Causely now splits root cause access into two tools. `get_root_causes` returns a summary of active root causes, and the new `get_root_cause_details` tool returns the full detail for a single root cause: the causal chain explaining why it was identified, blast radius, symptoms, exceptions, events, and logs.
Previously agents received full detail on every root cause in a single call, which filled the context window with data they did not need yet. Now an agent scans the summary first, then pulls detail only for the root cause it decides to investigate. This keeps responses lean and lets the agent control when it spends tokens on depth.
[Learn more about tools](/agent-integration/mcp-server/)
### Faster MCP tool responses
MCP tool responses are now about 30% faster on average, and 80% or more faster in some cases.
Agents spend less time waiting between steps, so an investigation or fix moves from one action to the next with less delay.
### Grafana alerts
Causely now ingests alerts from Grafana.
If your team runs alerting through Grafana, those alerts feed into Causely and get mapped to symptoms automatically, the same way Prometheus alerts already do. You get causal analysis on the alerts you already have, with no change to how you alert today. Active alerts turn on the matching symptoms and clear when they resolve, so Causely stays in sync with what Grafana is firing.
[Learn more](/telemetry-sources/grafana#alerts)
### Minor Improvements
- **Docker trace processing:** Improved trace processing in stand-alone Docker environments.
- **Self-hosted agent auth:** Improved MCP authentication for self-hosted coding agents, for example [Cline](https://cline.bot/).
- **Controller root cause diagnosis:** Improved the detection logic for Controller Malfunction and Image Pull Error root causes for more accurate diagnosis.
---
## v1.0.134
## Release Notes — v1.0.134
### Expanded Dynatrace Support
Causely now ingests how data flows between application components and underlying infrastructure directly from Dynatrace instrumentation, including public cloud and on-prem environments such as VMware. Your existing Dynatrace infrastructure alerts now inform the model automatically, mapping to infrastructure symptoms Causely already tracks, alongside the application-layer alerts already mapped. This makes it easier to put Causely's semantics and causal model on top of your Dynatrace instrumentation wherever your applications run, so you reach the cause of alerts faster and dramatically reduce alert noise and MTTR. You can also connect that semantics to an AI agent for autonomous remediation.
[Learn more](/telemetry-sources/dynatrace/)
### More Specific Root Cause Names
Root cause names in the UI are now titled from the specific evidence collected in logs, metrics, and events. Generic names made it hard to tell active issues apart when scanning an environment with several at once. The root cause type, for example Service Malfunction, now appears as a tag you can filter on, so you get a more accurate read on the underlying cause of a problem or performance degradation.
### Horizontally Scalable Mediator
The Causely mediator can now be enabled to scale horizontally. At high trace volumes and span cardinality a single mediator may became a CPU bottleneck, limiting complete trace processing. Span analysis is now offloaded across horizontally scalable pods, so trace processing stays complete even in very large environments. Enabling and correctly sizing this requires configuration; contact our support team for guidance.
[Learn more](/installation/scalable-trace-processor/)
### Minor Improvements
- **Topology:** Improved stitching of GCP and AWS Application Load Balancers to Kubernetes services, for a more complete representation of the topology.
- **Topology:** Health state visualization is more accurate when symptoms are active but no cause has been inferred, or when there is insufficient data to determine current state.
- **Notifications:** Entity name filtering including regex is now supported.
- **SLOs:** Availability SLOs now respect service tiers. [See service prioritization](/configuration/service-tiers/) for detail.
- **Prometheus:** At large scale, alerts are now processed reliably and mapped to Causely symptoms.
- **Prometheus:** Active alerts and alert rules discovered from Prometheus are now visible on the Integrations page.
- **MCP (get_symptoms):** Improved to answer questions such as what deployments happened in a cluster or namespace over a recent window.
---
## v1.0.135
## Release Notes — v1.0.135
### Introducing Issues
Causely now groups every diagnosis of the same underlying problem into a single Issue: one thing to acknowledge, one thing to share with your team, one thing to resolve. Before Issues, a recurring problem surfaced as a scatter of separate diagnoses with no durable object linking them, so on-call engineers rebuilt the through-line by hand each time it resurfaced. An Issue gives engineers and agents one place to see the problem, the evidence behind it, and the best path to resolution. This is an early access release, and we are working toward making Issues the primary notification payload Causely sends to agents and on-call channels.
As part of this release, Root Causes are now diagnoses and Symptoms are now Signals, giving on-call engineers and agents a more complete picture of an Issue, the evidence behind it, and the path forward.
[Learn more](https://www.causely.ai/blog/introducing-issues-one-problem-one-thread-start-to-finish)
### Act on Issues
You can now act on an Issue directly from the UI, so triage no longer means leaving Causely to take the next step. Available actions:
- Send the Issue to an agent, for example Claude or Cursor, to investigate or resolve.
- Add a notification so the next occurrence is sent automatically to a Slack channel or a background agent.
- Snooze the Issue so a recurrence stops notifying you and moves to the Incidents tab.
### MCP Tool Improvements
New Issues tools: `get_issues` returns active Issues across the environment, and `get_issue_details` returns a single Issue with every diagnosis grouped under it. These should be an agent's primary calls when determining what is currently impacting services or components.
`count_entities` is new. Agents can now grasp the shape of an environment, and what is currently breaking, in far fewer calls.
`get_root_causes` and `get_root_cause_details` have been replaced by `get_diagnoses` and `get_diagnosis_details`.
Note that skills have been updated to ensure efficient routing for these new tools. Make sure you update your agent to the latest skill definitions.
[Learn more](/agent-integration/mcp-server/)
### Minor Improvements
- **Signal activation delay:** You can now configure Signal activation delay directly from the UI. [More here](/configuration/symptom-delay/)
- **Notification payload:** Custom names for diagnoses, formerly root causes, are now included in the notification payload.
- **Google Cloud Mesh:** Causely now discovers and stitches cross-cluster communication over Google Cloud Mesh. This delivers full topology mapping and causal attribution when services communicate across clusters, closing a blind spot that previously broke the dependency graph at the cluster boundary.[More here](/telemetry-sources/gcp/#supported-gcp-services)
- **Mediator trace processing:** Improved mediator trace processing performance so fewer traces are dropped.
---
## v1.0.137
## Release Notes — v1.0.137
### Sharper Issue summaries and titles
Issue summaries and titles are now generated from the symptoms that define the associated diagnosis, the facts of what is actually wrong, rather than from the surrounding logs and events. Before, generated text could drift toward incidental activity that happened nearby instead of the real problem. Grounding on symptoms produces titles and summaries that describe the actual fault, so what you read matches what is wrong and agents get a cleaner starting point.
### Expanded coverage
Causely now observes and reasons over more of your stack. This release adds support for [Conduktor](/telemetry-sources/prometheus/#supported-exporters), [MongoDB Atlas](/telemetry-sources/mongodb-atlas/). Before, these systems sat outside the causal model, leaving gaps where dependencies and failures went unseen. Bringing them in means diagnoses and blast radius account for more of what your services actually depend on.
### Fewer steps to connect an agent
Connecting an agent to Causely is now a shorter path. The connect flow includes a direct link into VS Code. Before, connecting an agent or acting on a suggestion meant several manual hops. These links cut that friction so a first agent connection lands faster. In addition, the docs have been updated on adding skills to [VS Code](/agent-integration/mcp-server/vscode-copilot/#step-2-add-the-skills) and [Codex](/agent-integration/mcp-server/codex/#step-2-add-the-skills) clients.
### Minor Improvements
- **MCP enabled by default BYOC:** The Causely MCP server is now on by default in BYOC deployments, so self-hosted environments can connect an agent without a separate enable step.
- **IAM authentication for RDS Postgres:** Added IAM authentication for RDS Postgres in BYOC deployments.
- **Database discovery and reliability:** Fixed Azure Postgres discovery and hardened MySQL connection and SSL handling for more reliable coverage of managed databases.
- **Beyla service performance metrics:** Causely now collects service performance metrics from Beyla, enabling more complete understanding of request throughput.
- **Operator-managed Beyla updates:** The operator can now update Beyla automatically, so instrumentation stays current without manual intervention.
- **Network endpoint discovery:** Causely now discovers network endpoints from HTTPRoute hostnames, improving topology accuracy for gateway-routed traffic.
- **MCP tool feedback:** You can now submit feedback on MCP tool responses, giving Causely a signal to improve answer quality over time.
- **AWS Disks:** Improved monitoring of AWS Disks ensuring more accurate diagnosis where there are symptoms affecting disk usage.
- **Issue timeline readability:** Cleaned up the Issue timeline, including removing redundant recurring-event grouping, so the sequence of what happened is easier to follow.
---
## v1.0.138
### Issues are now the primary notification
Notifications now reference the Issue rather than an individual diagnosis. Before this, a single problem could produce several notifications tied to different diagnoses, so engineers and agents picked up fragments of the same problem and worked them separately. Routing on the Issue means one problem produces one thread from detection to resolution, and the people and agents responding are looking at the same object.
[Learn more](/getting-started/how-causely-works/#issue-diagnosis-and-signal)
### A better Act on this
Act on this now carries more of the Issue with it. The generated prompt includes richer context, so it is useful even before you have connected an agent to the Causely MCP server. You can send an Issue straight to VS Code, and Act on this is now linked directly from Issue notifications, so responders go from the notification they received to an agent working the Issue without reassembling context on the way.
### Optional auto-update for Mediator and agent
The operator can now update the Mediator and agent automatically. Before, staying current meant a manual upgrade step in each cluster, and environments drifted between versions. Turning auto-update on keeps clusters on the current version without an operator action per release. It is opt-in, so clusters that require change control can stay on manual upgrades.
[Learn more](/installation/operator)
### Minor Improvements
- **MCP Quick Start:** Clearer setup path for connecting an agent to Causely.
- **Gateway API topology:** Causely now resolves backing services behind Kubernetes Gateway and HTTPRoute specs, including ServiceImports. Dependencies that previously terminated at the gateway now resolve to the service actually handling the route, which keeps blast radius and causality from being attributed to the gateway itself.
- **Issue to diagnosis consistency:** Improved consistency between an Issue and the diagnoses attached to it, and recurring occurrences of the same problem are now grouped on the Issue.
- **External service impact notifications:** When an external service degrades, owners of the client services impacted by it are now notified.
- **Diagnosis summaries without evidence:** A diagnosis now returns a summary even when supporting evidence is not available, so a diagnosis is never surfaced as an empty result.
- **AWS ingress coverage:** Broader discovery of AWS ingress configurations, including load balancers that route directly to pod IPs.
- **GCP disk discovery:** Disk limits are now discovered for g4 instance types and Hyperdisk.
- **Prometheus fetch tuning:** PromQL data fetching can now run in parallel with a configurable concurrency, which shortens collection time on large Prometheus sources.
---
## v1.0.139
### Configure Causely from your agent
Causely's MCP server now includes tools for configuring detection: metric thresholds, service priority tiers, and Issue snoozing. Until now these settings were only available in the UI, so tuning noise or onboarding a new service meant leaving the agent session used to investigate. An agent or engineer can now raise a threshold when a Signal fires on a value that is normal for that service, prioritize or hide an entity, enable SLO tracking on a non-Service entity such as an HTTP path or queue, and snooze an Issue until a chosen time, all in the same conversation. Configuration tools require the Developer or Administrator role.
New tools: `create_threshold_configuration`, `get_threshold_configurations`, `update_threshold_configuration`, `delete_threshold_configuration`, `get_supported_threshold_metrics`, `get_service_tier`, `set_service_tier`, `clear_service_tier`, `ignore_issue`, `unignore_issue`, `get_issue_ignore_status`.
[Learn more](/agent-integration/mcp-server/#configuration)
### Entity Causality graph
Causely now includes an Entity Causality graph that shows how Causely's causal knowledge applies to your topology. For any entity, you can see which diagnoses Causely can identify on it, which Signals each diagnosis would produce, and how those effects propagate to the entities that depend on it. Before, this was presented as a flat list of Signals, so it was hard to tell how they connect and propagate through the entities in your system. The graph lets you inspect that understanding ahead of time and confirm the model reflects how your system actually fits together, across services, infrastructure, and the dependencies between them.
### More precise Issue grouping and summaries
Issues now merge only when their Signals overlap within a bounded time window. Before this change, a broad diagnosis such as node CPU congestion could pull unrelated Issues into one thread spanning many services, which made the Issue hard to act on. Issues stay scoped to one problem, and when Issues do merge, the start time reflects the earliest diagnosis rather than the moment of the merge.
Issue titles and summaries are also more specific, and description generation is fixed in environments where titles were generated but descriptions were not. The summary generator is stricter about log relevance, reducing cases where unrelated log noise, such as TLS errors from internet scanners, is presented as causal.
### Minor Improvements
- **Weekly email:** The weekly summary email now reports Issues rather than root causes, matching the rest of the product.
- **GKE Autopilot:** Causely now installs on GKE Autopilot clusters, which previously rejected the agent and Mediator due to host networking and hostPath restrictions.
- **Multi-cluster gateway discovery:** GKE Gateway API discovery across a multi-cluster fleet no longer creates duplicate gateways with the same name.
- **Microsoft Teams notifications:** Fixed notifications rejected by Teams because of an unsupported action in the card body. This affected both diagnosis and Issue notifications.
- **Notification configs:** Removing a cluster from a notification config now stops delivery from that cluster without a manual Mediator restart.
- **Entity summary:** The event timeline is now sorted chronologically.
- **Data sources table:** The cluster name column is wider by default.
---
## v1.0.140
### MCP output separates observed Signals from generated summaries
`get_issues` and `get_issue_details` now return the observed Signals and the generated summary as clearly distinct parts of the response. Before this change, agents received both in one block and could treat the summary as ground truth. Agents can now reason and act on the observed evidence, and verify the summary against it before taking a step.
### MCP prompts guide agents on how to use Causely tools
The Causely MCP server now publishes prompts, as defined in the MCP specification, alongside its tools. Tool descriptions say what each tool returns; prompts tell an agent how to sequence tools for an investigation, consistent with the Causely skills. Agents connecting to Causely get the same investigation workflows out of the box, without a custom system prompt per client.
### MCP Inspector in the product (early access)
You can now browse the Causely MCP tools, see example inputs and outputs, and run tool calls against your own environment from within the Causely UI. Until now, trying a tool meant wiring up an external MCP client first. This gives teams building agent workflows a place to start before writing any code. Available in early access; contact Causely to enable it.
### Configure SLO targets
The SLO target for a service, for example 99% or 95%, and the burn rate threshold that marks an SLO at risk are now configurable through the API and the MCP threshold configuration tools. Causely generates an SLO for every service automatically, and those SLOs drive the urgency of Issues, so until now every service was held to the same default target regardless of how critical it was. Teams can tighten targets on revenue-critical services and relax them on internal ones, and Issue urgency follows. Through MCP, use `create_threshold_configuration` and `update_threshold_configuration` with the `TargetThreshold` and `BurnRate` keys, scoped to a single SLO, a label selector, or globally.
[Learn more](/configuration/slo-configuration/)
### Minor Improvements
- **Notifications by Issue category (API):** Notification rules can now filter on Issue categories such as Congestion, Malfunction, Frequent Crash, and Infrastructure instead of naming individual diagnoses, and notifications send updates as an Issue changes. Available through the API in this release.
- **MCP OAuth:** The OAuth flow now enforces PKCE and issues refresh tokens. Connectors stay authorized after access tokens expire instead of prompting each user to re-authorize.
- **Latency thresholds:** The minimum latency threshold has been raised so brief, low-latency deviations no longer produce urgent Issues.
- **Potential diagnoses:** The potential diagnoses view now uses the entity causality graph, so what could break for a given entity reflects the current model.
- **Notification setup:** The token field is now flagged as required when a Slack channel ID is provided without a webhook URL.
- **Integrations page:** The cluster column is wider by default, and cluster names no longer link to an empty cluster entity page.
- **Kafka topics on unknown brokers:** Kafka topics on unknown brokers discovered through traces were sometimes classified as queues. They are now identified correctly.
- **Remediation guidance:** The remediation disclaimer now appears only where it is relevant, rather than on every remediation.
---
## v1.0.141
### Causality graph for agents
Causely MCP tools now return the entity causality chain behind a diagnosis. Previously, agents received a diagnosis and its symptoms but had to piece together how the problem spread across entities. `get_diagnosis_details` and `get_issue_details` now return each affected entity, its distance from the root entity, and the symptoms, events, and SLOs the diagnosis causes there, so agents can explain why Causely reached a diagnosis from the causal model itself. In the portal, the Causality graph now hides workloads with no symptoms, which reduces noise for services with many replicas.
### Detection of rejected requests on internet-facing services
Causely now detects when a service rejects requests because of authentication failures (401, 403), rate limiting (429), or policy rejections (451). Previously, an API gateway or other internet-facing service could reject traffic and still look healthy, because its callers are not instrumented and most 4xx responses were counted as successful requests. These services now produce a diagnosis based on their own inbound traffic, even when every client is on the public internet.
[Learn more](/reference/root-causes/?category=Service&subcategory=Service)
### Issue-first navigation
Issues are now the primary entry point for investigation, in the portal and for agents. Diagnosis is no longer in the side navigation and remains available at its existing URLs. The API and MCP tools now navigate from an alert or entity directly to its related Issues, so agents no longer need a separate lookup to find the Issue behind an alert.
### Minor Improvements
- **Notification filters:** Notifications can now filter on the number of degraded services, so you can notify only when an Issue affects more than a set number of services.
- **SLO tool:** `get_slo` now reports the share of error budget remaining. Previously, it could report each objective's margin instead. `is_violated` and `is_at_risk` now follow SLO severity.
- **Service summary tool:** `get_service_summary` accepts a cluster name, so agents can target the production service rather than a same-named service in staging. The status line is now derived from the same diagnoses, SLOs, and metrics shown in the summary, and name resolution errors are reduced.
- **MCP reliability:** Filter tools return an explicit error when a cluster or namespace name matches nothing, instead of an empty result an agent could read as healthy. `name_lookup` matches namespace and cluster names more tolerantly, an unknown entity ID returns a not-found error, and OAuth for MCP connections is improved for enterprise agent platforms.
- **Logs and events in MCP:** Error lines show at least the full first line, grouped by signature with a count and first and last seen times. Version changes name the from and to image or revision.
- **MCP prompts:** The Causely MCP server now provides prompts that guide agents through common workflows, consistent with Causely skills.
- **Load balancer and endpoint topology:** When an AWS ALB or NLB port maps to more than one service, Causely links traffic to the Service that owns the load balancer instead of skipping the link. GKE Ingress and internal passthrough load balancers resolve to the real backend service, and stale external services are dropped.
- **Access thresholds:** Thresholds on access entities are now derived correctly from their HTTP path, and activation delay is no longer configurable on individual access entities.
- **Notifications from merged Issues:** Cleared Issues no longer send stale notifications after being merged into another Issue.
- **GKE ARM nodes:** The Causely agent now rolls out on GKE ARM nodes, which carry a default `arm64` taint.
- **MCP Inspector:** The MCP Inspector page no longer refreshes and resets responses during a session.
---
## v1.0.142
### Observe as a telemetry source
Causely now integrates with Observe to discover the Kubernetes clusters that send data to your Observe tenant, including their nodes, pods, containers, and services. Causely reads this infrastructure, its container and node metrics, and its container logs through the Observe API, so the Mediator doesn't need to run in or have access to those clusters. New clusters are picked up automatically, and container logs from Observe are used as evidence for diagnoses.
[Learn more](/telemetry-sources/observe/)
### Cluster-level scheduling diagnoses
Causely now diagnoses scheduling failures at the cluster level. When pods across many workloads stay Pending because no node has enough unreserved CPU or memory, or because nodes are cordoned during a node pool upgrade, Causely identifies the cluster as the root cause. Before this change, each affected workload was diagnosed separately, which hid the shared capacity problem behind many unrelated-looking Issues. When the scheduler message is not a recognized cluster-wide reason, a general Failed To Schedule diagnosis is shown instead.
[Learn more](/reference/root-causes/infrastructure/#cluster)
### Throughput drop reasoning
Causely now reasons about throughput drops as part of its causal model. Alerts that report lower-than-expected traffic on a service, operation, queue, or topic map to Throughput Drop Signals, and for queues and topics the Signal reflects whether producers are sending fewer messages or consumers are receiving fewer. Causely can then infer when a throughput drop explains the other Signals and alerts you are seeing, or which diagnosis explains the drop itself. Before this change, a drop in traffic was hard to place in an investigation because error rate and latency often stayed healthy while work stopped flowing.
[Learn more](/reference/symptoms/datapipeline/)
### Minor Improvements
- **Dynatrace container logs:** Causely now fetches container logs from Loki, Splunk, or Elasticsearch for containers discovered through Dynatrace.
- **Dynatrace discovery:** Dynatrace entities are fetched in parallel shards, which reduces discovery time in large environments.
- **Log-based diagnoses:** The error log that triggered a log-based diagnosis is now always included in its evidence. Query and cache key values echoed in log lines no longer split one log pattern into many.
- **Entity name matching:** Name matching now ignores underscores, hyphens, and spaces, so names such as `checkout_service` and `checkout-service` resolve to the same entity.
- **Entity labels:** Labels are now applied to entities in the Mediator repository.
- **Beyla and OTLP attribution:** The priority between Beyla and OTLP for entity attributes has been swapped, and attribute ownership can now be reset.
- **Service summary and entity health tools:** `get_service_summary` and `get_entity_health` now report Issues instead of diagnoses, matching the rest of the product.
- **Thresholds:** Fixed minimum thresholds for request rate and database query duration.
- **OpenTelemetry certificate validation:** Certificate validation for OpenTelemetry telemetry is now configurable.
- **OIDC:** Causely now falls back to alternative tenant and user ID claims, so more identity provider configurations work without changes.
- **Mediator memory and stability:** The Mediator streams its persisted store on load instead of reading it fully into memory, so startup no longer doubles memory use. Memory no longer grows when no remote Mediator is connected, and a crash caused by invalid metric values is fixed.
- **GKE ARM nodes:** The Mediator now includes default tolerations for GKE ARM nodes.
- **GCP C4A:** Causely now supports GCP C4A machine types.
- **Azure scraper logs:** Azure 404 Not Found errors no longer appear in scraper full sync logs.
- **Component updates:** Beyla is updated to 3.39, and the Causely base image is updated to Alpine 3.24.