1.0.88
August 11, 2025
Version 1.0.88Root Cause View—Sort Historical Root Causes by Symptom Count and Duration
Understanding what happened in past incidents is key to preventing them in the future and conducting more effective postmortem analyses. We've made this easier with new sorting options in the Historical Root Causes view:
- Symptom Count: Focus on root causes that triggered a significant number of symptoms. These often represent issues with a large blast radius that, if they recur, can have substantial impact on the environment.
- Duration: Pinpoint issues that have been degrading performance for a significant time and need to be addressed to restore stability.
For clarity, the Symptoms, Services Degraded, Duration, Start, and End columns now reflect the occurrence that matches your selected sort order. For example, if you sort by Symptoms, you'll see the occurrence with the highest symptom count; if you sort by Duration, you'll see the occurrence with the longest duration, and so on.
Ask Causely—Smarter Natural Language Investigations
Ask Causely, our natural language interface for understanding what's going on in your environment, just got more powerful.
You can now:
- Access more metrics across more entities, including disks.
- Quickly get summarized views of key metrics over time for faster analysis.
- Investigate faster by simply asking questions, even if you're not deeply familiar with the environment.
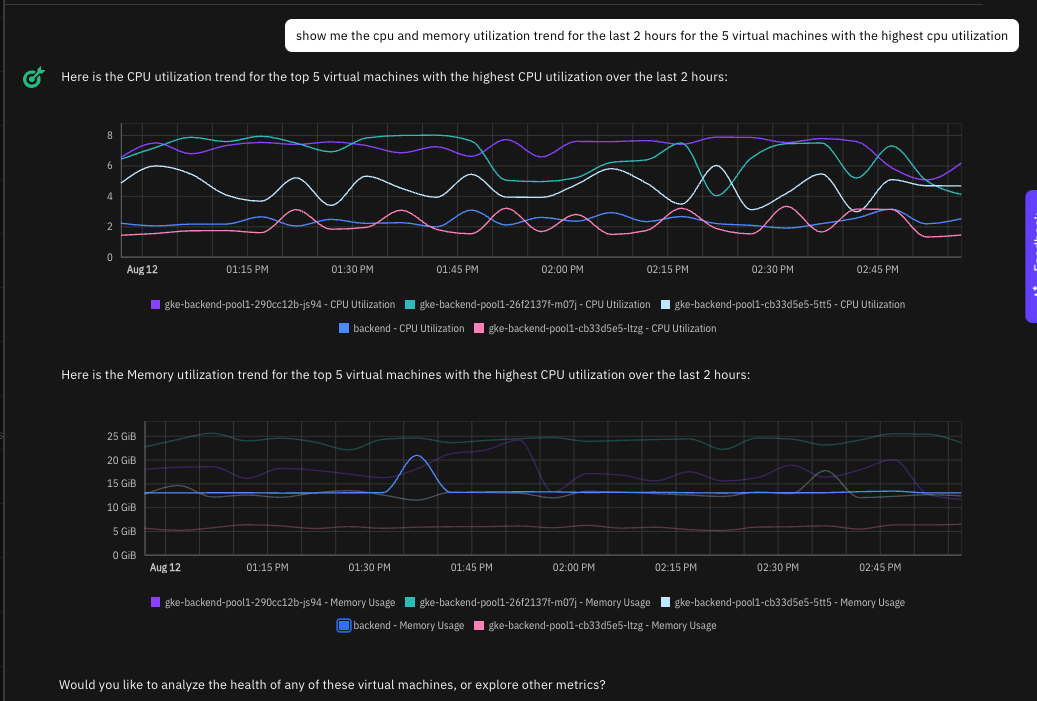
For example, you can now ask:
"Show CPU and memory utilization for the virtual machines with the highest CPU over the last few hours."
…and instantly see the charts you need to take action.
Did You Know?
Greater root cause clarity with database instrumentation
Without adding any additional instrumentation, and by leveraging eBPF, Causely discovers databases in your environment, including Postgres, MySQL, MongoDB, CockroachDB, and more. Causely represents these databases as services and will correctly infer them as the source of root causes impacting other services (for example, service congestion causing increased latency or error rates).
You can gain access to more specific database-related RCs by configuring Prometheus as a data source. We support exporters for Postgres, MySQL, MongoDB, CockroachDB, which will enable Causely to infer RCs such as:
- Slow Database Query: Database queries are taking longer than expected, slowing dependent services and risking resource starvation.
- Database Connection Pool Saturated: All available connections in the client-side database pool are in use, blocking new queries and potentially causing requests to hang or fail.
You can take this one step further by adding instrumentation for Postgres or MySQL. By adding specific instrumentation for Postgres or MySQL in Causely, you unlock:
- 3 additional root causes on the database table entity:
- Malfunction: The database table is degraded or erroring, causing slow queries, potential errors, and reduced performance for dependent applications.
- Excessive Lock: An abnormally high rate of exclusive locks is blocking concurrent access to the table, creating a performance bottleneck for client applications.
- DDL Excessive Lock: Frequent DDL locks are blocking both reads and writes during schema changes, disrupting and slowing all dependent services.
- The ability to view slow queries directly from a database table in the UI.
Bug Fixes and Minor Improvements
- Added support for multi-tenant Mimir deployments, you can learn more here
- Improved formatting and clarity in the weekly email digest to make it easier to review notable root causes.
- Enhanced performance of Ask Causely queries when returning large datasets.