Applications
Software programs designed to perform specific tasks or functions for end-users or other systems.
In the Causely user interface, these root causes appear under the corresponding application entity.
.NET Unhandled Exception
.NET logs show an unhandled exception, indicating the application failed unexpectedly and may have terminated the process. Unhandled exceptions in .NET typically indicate application logic errors, invalid state, or dependency failures that were not caught. Depending on hosting mode, this can fail the current request, terminate a worker loop, or crash the process entirely.
Access Throttled
The application is receiving HTTP 429 "Too Many Requests" responses, indicating that it has exceeded the rate limits set by the other service. This can cause degraded functionality, slow performance, or temporary service unavailability for end users. HTTP 429 errors are typically triggered when an API or service imposes rate limits to control the volume of incoming requests.
Apache Worker Exhausted
Apache HTTPD has reached its MaxRequestWorkers limit, meaning all worker slots are occupied and new requests cannot be processed. Apache prefork and event MPMs log "server reached MaxRequestWorkers setting, consider raising the MaxRequestWorkers setting" when all worker slots are busy. New connections are queued up to ListenBacklog, then dropped. This indicates either a load spike or slow request processing holding workers.
Application Error Spike
The service is emitting a high volume of ERROR or CRITICAL log lines over a rolling window, indicating an active application-side failure with no matching specific log signature. Common causes include schema or payload mismatches after a deploy, repeated business-logic exceptions, dependency failures logged as generic errors, and application regressions that produce many error-level logs without a canonical runtime signature. This signal indicates the application is actively failing rather than providing a precise diagnosis of the underlying cause. This root cause activates when generic error-severity log volume exceeds 2,000 occurrences within a one-hour window.
Cassandra Tombstone Pressure
Cassandra reads are scanning excessive tombstones, indicating partition design or TTL issues that are causing significant read latency and resource pressure. Cassandra logs a warning when a read scans more tombstones than tombstone_warn_threshold (default 1000). Tombstones are markers for deleted data that must be scanned until compaction removes them. Excessive tombstones cause read amplification, increased GC pressure, and can trigger ReadTimeoutExceptions.
Circuit Breaker Open
A circuit breaker protecting an upstream dependency has opened, causing the service to fail fast on calls to that dependency instead of waiting for timeouts. Circuit breakers such as Resilience4j and Netflix Hystrix open when an upstream dependency exceeds a configured failure rate or slow-call threshold. While open, all calls to the dependency are immediately rejected to prevent cascading failures and reduce latency. This is a protective mechanism, but it surfaces as errors for callers.
Connection Pool Exhausted
The database or service connection pool is exhausted, and new connection requests are being rejected, causing application errors for all callers. Connection pool exhaustion occurs when all connections in the pool are in use and no connection becomes available within the timeout. Sources include PostgreSQL "sorry, too many clients already", MySQL error 1040, Redis "max number of clients reached", HikariCP timeout, or pgBouncer limit. This typically indicates a connection leak, long-running transactions holding connections, or insufficient pool sizing for the load.
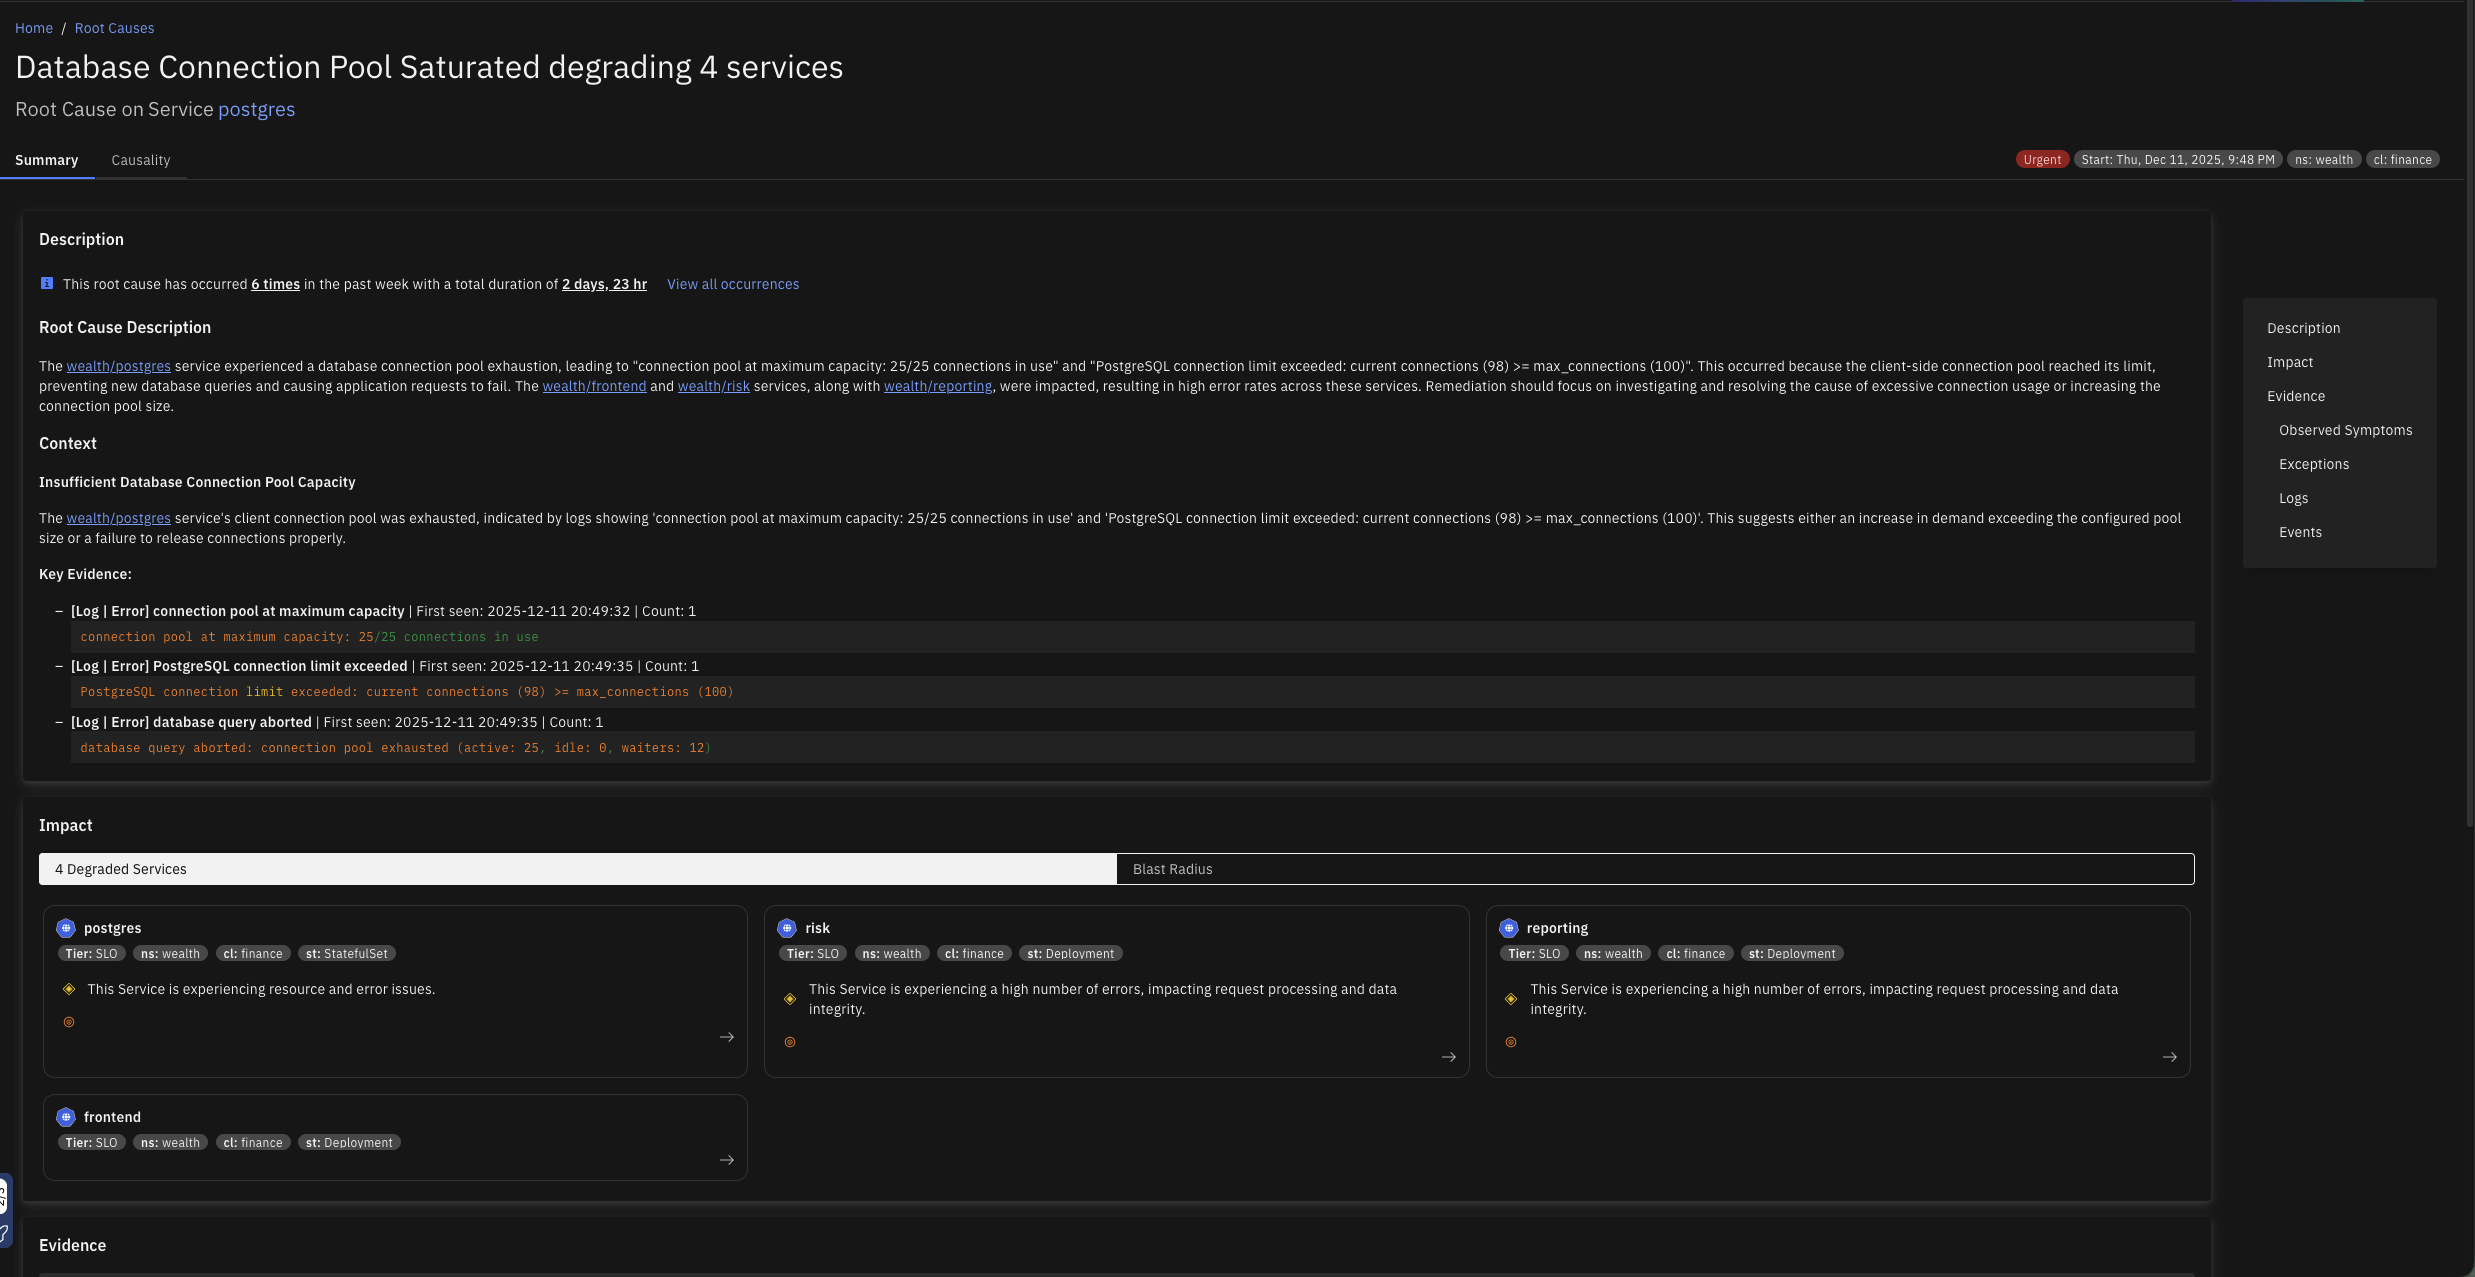
Database Connection Pool Saturated
The client-side database connection pool is exhausted when all available connections are in use, preventing new database queries from being executed. This can cause application requests to hang or fail, impacting user experience and potentially leading to downtime for database-dependent features.
Database Malfunction
The database is returning a high rate of errors or failing to respond to queries, causing disruptions for services and clients that depend on it. This may result in delayed or failed access to one or more tables, leading to degraded application performance, elevated latency, or complete unavailability of database-backed functionality.
Disk Full
A filesystem used by this service has run out of space (ENOSPC), causing write operations to fail. "No space left on device" errors occur when a write() syscall fails because the filesystem has no free blocks. Logs, data files, temp files, or WAL segments may all contribute to disk exhaustion. This causes immediate write failures and can cause the process to crash or enter a degraded state.
Elasticsearch Cluster Unhealthy
The Elasticsearch cluster health status has transitioned to RED, indicating one or more primary shards are unassigned and data is unavailable for those shards. Elasticsearch reports RED health when at least one primary shard is unassigned. Search and indexing requests for affected indices will fail. This is caused by node failures, insufficient nodes to satisfy the index replication factor, or shard allocation issues.
Excessive DNS Traffic from Client
The application is generating an unusually high volume of DNS requests, potentially overwhelming DNS servers, increasing latency for users, and risking service disruptions. This behavior may also incur additional costs or trigger rate-limiting from DNS providers. This typically arises when the application initiates DNS lookups more frequently than necessary due to lack of effective caching, redundant DNS resolution logic, or misconfigurations.
File Descriptor Exhaustion
The application has reached the system-imposed limit on the number of file descriptors it can open. This typically leads to errors such as "Too many open files," preventing the application from creating new connections, reading files, or accessing resources. This can severely impact functionality, particularly in high-concurrency or high-I/O scenarios.
File Limit Exhausted
The process has reached the operating system file descriptor limit (EMFILE/ENFILE), preventing it from opening new network connections, files, or sockets. Each open socket, file, or pipe consumes a file descriptor. When the per-process limit (ulimit -n / RLIMIT_NOFILE) or system-wide limit (/proc/sys/fs/file-max) is reached, new open/accept/connect calls fail with EMFILE or ENFILE. This manifests as connection refused errors in network servers or file-open failures in data pipelines.
Go Deadlock
The Go runtime has detected a full deadlock where all goroutines are permanently blocked, causing the process to panic and exit. The Go runtime prints "all goroutines are asleep - deadlock!" and exits when it determines that no goroutine can ever make progress. This is a fatal condition and the process terminates immediately. Common causes include channel send/receive with no corresponding partner, mutex lock with no unlock, or sync.WaitGroup misuse.
Go Nil Pointer Panic
The Go runtime has panicked due to an invalid memory address or nil pointer dereference, causing the handler or process to fail. This panic occurs when code dereferences a nil pointer. In Go services, an unhandled panic usually terminates the current goroutine and may crash the whole process unless recovered. Common causes include missing dependency initialization, nil interface assumptions, unchecked map or pointer fields, or races around object lifecycle.
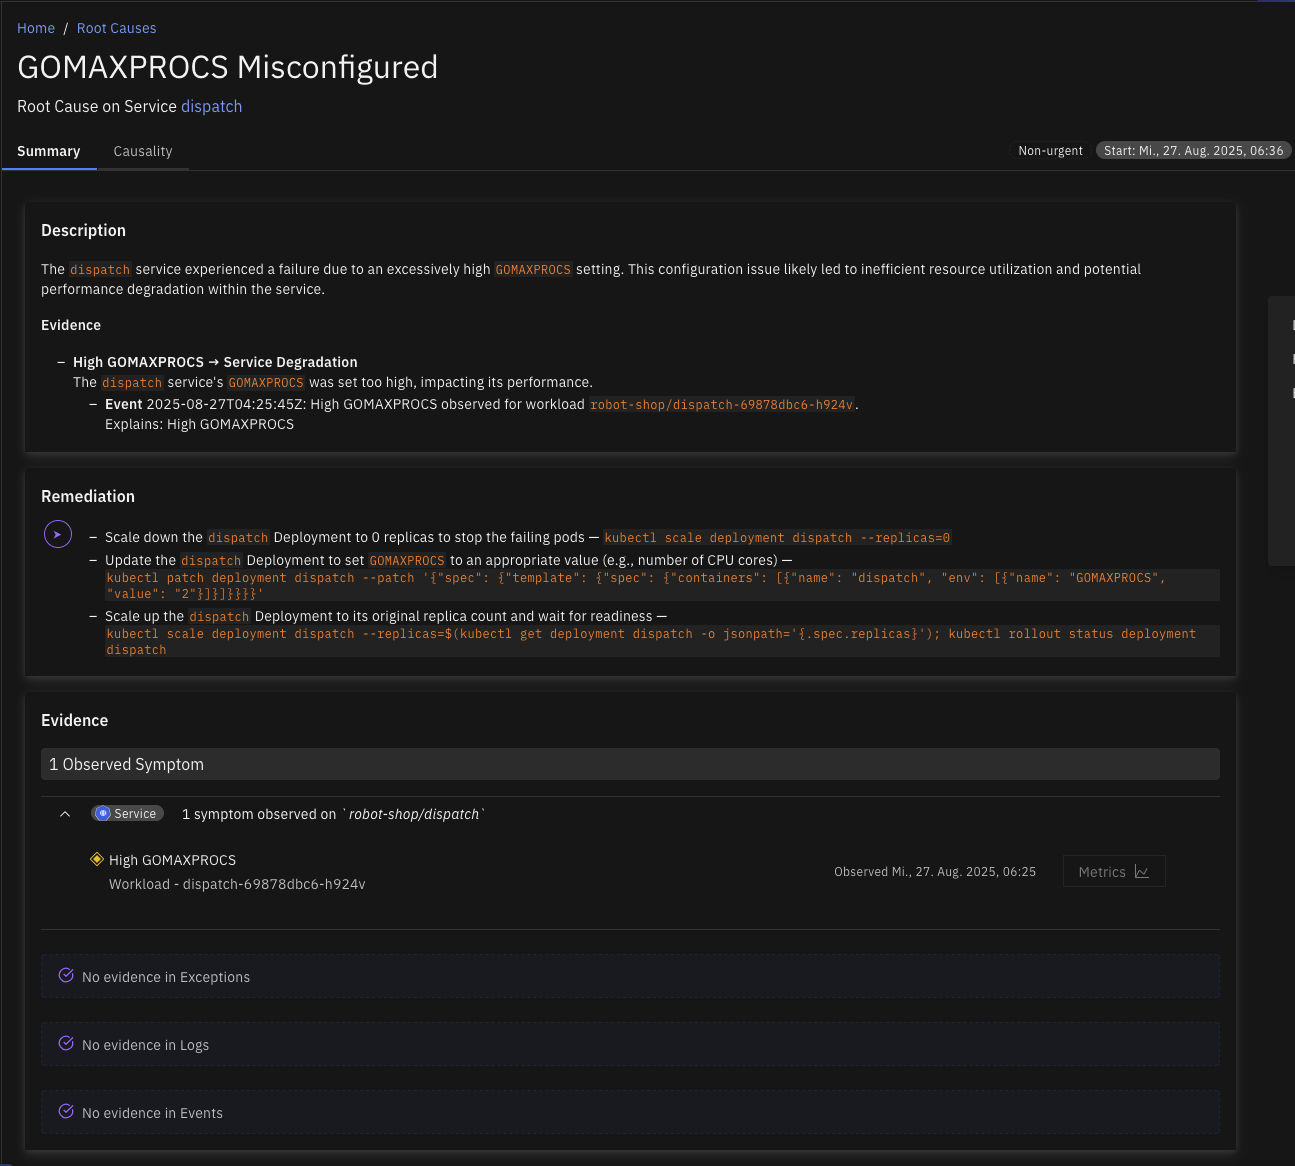
GOMAXPROCS Misconfigured
The environment variable GOMAXPROCS, which controls the maximum number of CPU cores the Go runtime uses, has been set higher than the CPU limit of the container in which the Go application is running. This mismatch can lead to inefficient CPU usage, reduced performance, and potential throttling because the Go runtime attempts to schedule more work than the container is permitted to handle.
HAProxy Backend Unavailable
HAProxy has no available backend servers, as all backends are either down or at their connection limit, causing all incoming requests to be rejected. HAProxy logs "backend has no server available" when every server in the backend pool is in DOWN state or has reached its maxconn limit. Clients receive a 503 Service Unavailable. This can be caused by all backend servers being unhealthy, a misconfigured health check, or a connection storm saturating backends.
Inefficient DNS Lookup
The application is making an unusually high volume of DNS requests, with over 80% returning NXDomain (non-existent domain) responses. This excessive DNS activity is adding 10 to 20 ms of latency to each request, negatively impacting service performance. The issue is often caused by the service or application attempting to resolve incomplete or unqualified domain names.
Inefficient Garbage Collection
The application is experiencing high latency and reduced throughput because a significant portion of its runtime is being spent in garbage collection (GC). This leads to frequent pauses, degrading overall performance and causing delays in request handling through all the dependent services. This issue usually occurs when the Java Virtual Machine (JVM) or other garbage-collected runtime environments are under memory pressure.
Invalid Client Certificate
The application is failing to connect to a service due to invalid certificate errors, preventing secure communication over HTTPS or TLS. This can cause downtime or degraded functionality for users relying on this service.
Java GC Pressure
The JVM garbage collector is under pressure, logging allocation failures or to-space exhaustion events, indicating the heap is too small or object allocation rates are too high. GC pressure manifests as "Allocation Failure" in ParallelGC/SerialGC logs or "to-space exhausted" in G1GC logs. Both indicate that GC cannot reclaim space fast enough to keep up with allocation demand. This leads to longer GC pauses, increased latency, and potential OutOfMemoryError if unresolved.
Java Heap Saturated
The JVM is operating with limited available heap memory, resulting in degraded performance or potential application crashes. This condition typically leads to frequent or prolonged garbage collection (GC) pauses, slow response times, and, in severe cases, OutOfMemoryError. It often reflects memory leaks, improper heap sizing, or excessive object allocation.
Java Null Pointer
The JVM has thrown java.lang.NullPointerException, indicating application code dereferenced a null reference and failed unexpectedly. A NullPointerException typically means application logic assumed an object was present when it was actually null. Depending on exception handling, this can fail an individual request or crash the process. Common causes include missing dependency wiring, invalid state transitions, bad deserialization assumptions, or unguarded optional values.
Java Out of Memory
The JVM has thrown java.lang.OutOfMemoryError, indicating the heap, metaspace, or GC overhead limit is exhausted and the process cannot allocate memory. OutOfMemoryError occurs when the JVM cannot satisfy an allocation request. Common subtypes include heap space (object allocation failed), Metaspace (class metadata exhausted), GC overhead limit exceeded (GC spending over 98% of time reclaiming less than 2% of heap), or unable to create native thread. The process may continue in a degraded state or crash.
Java Stack Overflow
The JVM has thrown java.lang.StackOverflowError due to runaway recursion or an excessively deep call stack that has exhausted the thread stack space. Each thread has a fixed stack size (-Xss). When recursive calls or deep call chains exceed this limit, StackOverflowError is thrown. Unlike OutOfMemoryError, this is usually a code defect such as infinite recursion or mutual recursion without a base case, or a framework issue with excessive proxy/interceptor wrapping.
Java Thread Pool Exhausted
The JVM thread pool is saturated and rejecting new task submissions with java.util.concurrent.RejectedExecutionException. ThreadPoolExecutor throws RejectedExecutionException when both the thread pool is at max capacity and the task queue is full and the rejection policy fires (default: AbortPolicy). This causes request handlers to fail, leading to increased error rates for callers.
Kafka ISR Shrink
A Kafka broker has logged ISR (In-Sync Replica) shrinkage, indicating that one or more follower replicas have fallen behind the leader and been removed from the ISR set. Kafka logs "ISR shrunk from [X] to [Y]" when a follower fails to keep up with the leader within replica.lag.time.max.ms. While a replica is out of the ISR, the effective replication factor is reduced, increasing the risk of data loss if the leader fails. Producers with acks=all will also experience increased latency or errors.
Kafka Partition Outage
Kafka has one or more offline partitions, meaning the cluster cannot maintain a healthy leader for those partitions and affected topic data is currently unavailable. This is a hard failure condition rather than a performance degradation: produce requests may be rejected and consumers cannot fetch from affected partitions until leadership is restored. Common causes include a broker outage that simultaneously removes leaders and replicas from the in-sync replica set, replication falling far enough behind that no eligible replica can be elected as leader, controller instability during broker flaps or cluster reconfiguration, and storage corruption or severe disk failure on a broker node.
Kafka Replication Degraded
One or more Kafka partitions are under-replicated, meaning followers are not keeping pace with the partition leader. This reduces fault tolerance across the cluster: if an additional broker is lost or a leader change is forced, the partition may become unavailable. The cluster may still be serving traffic, but producers and consumers are operating with reduced resilience. Common causes include disk I/O saturation on a follower broker slowing replica fetch or log flush, network congestion between brokers, a follower broker that is restarting, stuck, or under heavy load, and replication traffic competing with high-volume client produce traffic.
Kafka Storage Pressure
Kafka broker log storage utilization is high, causing degraded performance across produce, replication, and retention paths. Kafka depends on sequential log I/O, and as data-log disks approach capacity, flush, compaction, and replica synchronization operations become less efficient. This typically creates a starvation pattern of increasing broker latency, slower replication, and delayed producer acknowledgements rather than an immediate hard failure. Common causes include topic retention policies keeping more data than the disk budget supports, write rate growth exceeding storage throughput, a log compaction backlog consuming disk bandwidth, and uneven partition placement concentrating data on a single broker.
Lock Contention
The application suffers from inefficient locking, where suboptimal lock management leads to excessive contention and prolonged mutex wait times. This inefficiency degrades performance by increasing the risk of thread starvation under heavy load. This can stem from overuse of locks, coarse-grained locking strategies, or improper lock design.
Memory Exhaustion
The Broker application has exhausted its available memory, resulting in degraded performance and potential service disruption. When memory usage reaches critical levels, the system may experience increased garbage collection (GC) activity, higher processing latency, and, in severe cases, OutOfMemoryError events that halt message processing.
MongoDB Connections Exhausted
MongoDB is at or near its maximum connection limit, and new client operations may fail when they cannot obtain a server connection. MongoDB enforces a cap on concurrent active connections, and when that limit is reached, clients cannot establish or reuse connections fast enough, causing requests to fail before any database work is attempted. Common causes include application connection pools configured with an excessively high maximum size, connection leaks where clients open connections without properly releasing them, traffic spikes that create more concurrent clients than the server can handle, and long-running queries that hold connections for extended periods.
MongoDB Cursor Pressure
MongoDB has an unusually high number of open cursors, increasing server-side state management overhead and slowing query execution for callers. Open cursors represent active or partially consumed query result streams, and when too many remain open simultaneously, MongoDB must maintain more concurrent state and expend additional resources servicing them. This typically manifests as increasing latency and resource starvation rather than immediate request failures. Common causes include clients reading through large result sets slowly, applications that do not fully consume or explicitly close cursors, excessive polling or fan-out query patterns that create many simultaneous cursors, and batch sizes configured too small, which keeps individual cursors open longer than necessary.
MongoDB Replica Lag
MongoDB replication lag is high, meaning secondaries are applying oplog entries noticeably behind the primary. Read queries directed to secondaries may return stale data, and the replica set's readiness to complete a clean failover is reduced. The database continues to operate, but replication cannot keep pace with the primary write rate, degrading both read consistency and fault tolerance. Common causes include secondary nodes with insufficient disk or CPU resources for the current oplog apply rate, network latency or bandwidth constraints between replica set members, bursty write workloads that generate oplog traffic faster than secondaries can consume, and long-running workloads on secondaries that compete with the replication apply process.
MySQL Deadlock
MySQL InnoDB has detected a deadlock between two or more transactions and rolled one back to break the cycle. MySQL InnoDB logs "Deadlock found when trying to get lock; try restarting transaction" when two transactions hold locks that the other needs. The engine automatically selects a victim and rolls it back. Frequent deadlocks indicate lock acquisition order inconsistencies in application code.
Nginx Upstream Timeout
Nginx is logging upstream connection timeouts, indicating a backend service is not responding within the configured proxy_read_timeout or proxy_connect_timeout. Nginx logs "upstream timed out (110: Connection timed out)" when a backend fails to respond within the configured timeout. This causes nginx to return a 504 Gateway Timeout to the caller. The upstream service may be overloaded, deadlocked, or experiencing a network partition.
Nginx Worker Connections Exhausted
Nginx has exhausted its worker_connections limit and cannot accept new connections, meaning incoming requests are being dropped. Nginx's worker_connections directive limits the number of simultaneous connections per worker process. When all connections are in use, nginx logs "worker_connections are not enough" and new connections are refused. Total capacity equals worker_processes multiplied by worker_connections.
Noisy Client
The application acts as a Noisy Client, generating high number of requests that burden destination services with increased load and elevated request rates. This aggressive request pattern directly impacts destination services by driving a high request rate that can overwhelm service capacity and contributing to increased load on the destination.
Postgres Cache Hit Rate Degraded
Postgres shared_buffers cache hit rate has dropped, causing queries to read from disk and significantly increasing query latency. Postgres uses shared_buffers as an in-memory page cache for table and index data, and when the working set fits in shared_buffers queries are served from memory, but when the cache hit rate drops Postgres must read data from disk or OS page cache, which is orders of magnitude slower and causes query latency to increase for all clients. Common causes include shared_buffers being too small for the working set size, new query patterns accessing large table scans that evict hot pages, database growth causing the working set to exceed available memory, sequential scans on large tables, and a cold cache after a server restart until the working set is loaded.
Postgres Checkpoint I/O Pressure
Postgres checkpoint I/O write time is high, indicating disk saturation that increases latency for all database operations. Postgres periodically performs checkpoints to flush dirty pages from shared_buffers to disk to ensure durability, and when checkpoint_write_time is high the disk is being saturated by checkpoint I/O, which competes with query I/O for reads and writes and causes elevated query latency for all clients. It may also indicate that checkpoints are too infrequent, leading to large bursts of write I/O. Common causes include a high WAL write rate generating many dirty pages between checkpoints, checkpoint_completion_target being too low and concentrating I/O into a short burst, disk I/O throughput being insufficient for the write rate, min_wal_size or max_wal_size being too small and causing frequent checkpoints, and shared storage throughput limits being hit.
Postgres Connection Slots Exhausted
Postgres active connections are approaching or have reached max_connections, and new connection attempts from services will be rejected. Postgres uses a process-per-connection model and limits total connections via max_connections, and when this limit is reached new connection attempts receive "FATAL: sorry, too many clients already," causing services that cannot connect to fail their database operations. Connections also consume shared memory, so running near the limit causes additional resource pressure. Common causes include no connection pooler being in use, connection pools being misconfigured with too high a max_size, connection leaks where connections are opened but not properly closed, sudden traffic spikes creating more service instances than the pool can handle, and long-running queries holding connections that should be idle.
Postgres Deadlock
PostgreSQL has detected a deadlock cycle between concurrent transactions and terminated one to resolve it. PostgreSQL logs "ERROR: deadlock detected" when its deadlock detector finds a cycle in the lock wait graph. One transaction is chosen as the victim and receives an error and must be retried. Frequent deadlocks degrade throughput and cause user-visible errors.
Postgres Deadlock Storm
Postgres is experiencing a high rate of deadlocks, causing transaction rollbacks and forcing retries in upstream services. A deadlock occurs when two or more transactions each hold a lock the other needs, creating a circular dependency, and Postgres detects this and aborts one transaction with "ERROR: deadlock detected." The aborted transaction must be retried by the application, and a high deadlock rate causes elevated error rates, retry traffic amplification, and query latency spikes. Common causes include application code acquiring locks in inconsistent order across transactions, bulk UPDATE or DELETE operations without consistent row ordering, missing explicit locking where the application assumes order of operations, and high-concurrency workloads on the same rows without retry logic.
Postgres Idle-in-Transaction Accumulation
Postgres has idle-in-transaction sessions accumulating, and these sessions hold locks, prevent autovacuum, and cause compounding table bloat and lock contention. An idle-in-transaction session has started a transaction with BEGIN but is not actively executing any query, and it may be waiting for application-side processing, a network call, or simply be a leaked connection. These sessions hold all locks acquired during the transaction and prevent autovacuum from cleaning dead rows, and as they accumulate they cause lock contention, connection slot exhaustion, and eventually table bloat that degrades query performance. Common causes include the application opening a transaction and making an external API call or sleeping, an ORM or framework starting a transaction at request start but not committing promptly, a connection pool returning connections that were left in a transaction, and missing idle_in_transaction_session_timeout configuration.
Postgres Lock Contention
Postgres has a high number of sessions waiting to acquire locks, indicating contention from long-running or conflicting transactions. Lock contention occurs when multiple transactions attempt to modify the same rows or tables simultaneously, and sessions that cannot acquire the lock wait in the lock queue, consuming a connection slot and blocking progress. As waiting sessions accumulate, query latency rises and eventually all connection slots may be consumed. Common causes include long-running transactions holding row or table locks, missing or overly broad UPDATE or DELETE statements without appropriate WHERE clauses, idle-in-transaction sessions holding locks without doing any work, DDL operations such as ALTER TABLE or VACUUM FULL taking exclusive locks, and high-concurrency write patterns on hot rows such as counters or status fields.
Postgres Query Memory Spill to Disk
Postgres is writing temporary files because queries exceed work_mem, causing significant I/O overhead and query slowdowns. When a sort, hash join, or aggregate operation requires more memory than work_mem allows, Postgres spills intermediate data to temporary files on disk. Disk I/O for temp files is much slower than in-memory operations, and temp files compete with other I/O on the same storage. High temp file creation rates indicate queries are consistently exceeding the configured memory budget. Common causes include work_mem being set too low for actual query complexity and result set sizes, queries using ORDER BY, GROUP BY, or JOIN without appropriate indexes, many concurrent sessions each using their full work_mem allocation, and queries with multiple sort or hash operations where each gets its own work_mem allocation.
Postgres Replication Lag
Postgres standby replication lag is high, causing replica reads to return significantly stale data. Postgres streaming replication sends WAL records from primary to standbys, and replication lag is the delay between a write being committed on the primary and the standby applying it. High lag means read queries directed to replicas return stale results, which can cause data consistency issues for applications that read their own writes via replicas. Common causes include network bandwidth saturation between primary and standby, a standby I/O bottleneck where disk cannot apply WAL as fast as it arrives, long-running queries on the standby blocking WAL apply, the primary generating WAL faster than the network can deliver it, and the standby being under-provisioned relative to the primary write rate.
Producer Publish Rate Spike
The application is publishing messages at a rate significantly higher than normal, causing queue depth to grow and producer message rate to increase. This surge in publishing activity creates backpressure and can overwhelm downstream consumers. When the application experiences a producer publish rate spike, it generates messages at an abnormally high rate that exceeds the system's normal capacity, leading to queue depth growth and propagation of congestion to downstream destinations.
Python Unhandled Exception
Python logs show an unhandled exception or fatal interpreter error, indicating the application failed unexpectedly. An unhandled Python exception usually emits a traceback and terminates the active request, worker, or process. Common causes include missing input validation, bad assumptions about returned objects, dependency failures that are not caught, or unexpected runtime state.
RabbitMQ Resource Alarm
RabbitMQ has triggered a memory or disk resource alarm, and all publishers are blocked until the watermark is cleared. RabbitMQ sets a memory alarm when used_memory exceeds vm_memory_high_watermark (default: 40% of available RAM) and a disk alarm when free disk space falls below disk_free_limit. While any alarm is active, all connections that have published are blocked, causing producer services to stall.
Rate Limited
The service logs show repeated rate-limiting errors, indicating that the service or an upstream dependency is rejecting requests because a rate limit has been reached. Rate limiting is enforced by the service itself or by an upstream dependency such as an API gateway, an ingestion pipeline, or an external API. When the limit is exceeded, new requests are rejected or throttled, causing increased error rates for callers. Common sources of this pattern include ingestion services such as Grafana Tempo when write throughput exceeds the per-tenant ingestion limit, API gateways or proxies such as the nginx ngx_http_limit_req module when request rate exceeds the configured burst, and application-level rate limiters logging rate limit exceeded or rate limit reached when quota is consumed. The root cause is typically insufficient quota allocation, a sudden traffic spike, or a misconfigured rate limit policy rather than a code defect.
Redis Cache Miss Storm
Redis cache hit rate has dropped significantly, and upstream services are falling back to the database on most requests, multiplying database load. A cache miss storm occurs when Redis cannot serve requests from memory and callers bypass it to the backing database, dramatically increasing database query volume and latency for all services sharing that database. Common causes include memory pressure and key evictions, cache invalidation or a flush clearing a large portion of the keyspace, a cold start after the cache was restarted and not yet warmed, keys expiring simultaneously in a TTL cliff, and an application bug writing cache keys with wrong names that prevents future hits.
Redis Command Queue Saturation
Redis single-threaded command pipeline is saturated, and slow O(N) commands are blocking the event loop while BLPOP or BRPOP clients accumulate, causing upstream timeouts. Redis processes commands on a single thread, and when a slow command such as KEYS, SMEMBERS, SORT, or LRANGE on a large collection runs, it blocks all other commands for its duration. Clients waiting on BLPOP or BRPOP accumulate because they cannot be served while the thread is busy, and as blocked client count rises upstream services begin timing out. This root cause requires both signals to be present simultaneously: redis_slowlog_last_id or slow command log growth, and redis_blocked_clients above threshold. Common causes include application use of KEYS * or SMEMBERS on large keysets in production, large sorted sets or lists being iterated with single-command scans, and BLPOP or BRPOP patterns with no timeout or long timeout combined with slow producers.
Redis Connection Pool Saturated
Client-side Redis connection pool exhaustion occurs when all available connections in the pool are in use, preventing new requests to Redis. This can lead to request timeouts or failures, causing application disruptions for features relying on Redis for caching, messaging, or other operations.
Redis Memory Exhausted
Redis is rejecting commands because used_memory has exceeded the configured maxmemory limit, and clients receive OOM errors and writes fail. When Redis reaches its maxmemory limit, it enforces the configured eviction policy (for example allkeys-lru or volatile-lru). If the eviction policy cannot free enough space, or if maxmemory-policy is noeviction, all write commands are rejected with "OOM command not allowed when used memory > maxmemory".
Redis Memory Pressure
Redis server memory is at or near its configured limit, causing active key evictions that degrade cache effectiveness and increase load on downstream databases. Redis evicts keys when memory usage exceeds the configured maxmemory limit, and although the eviction policy determines which keys are removed, under heavy eviction the cache hit rate drops sharply and forces callers to read from the database instead, compounding into a database load spike. Common causes include the data set growing beyond allocated memory, no TTL being set on keys and causing unbounded growth, memory fragmentation consuming effective capacity, and a sudden traffic spike filling the keyspace faster than evictions can keep up.
Redis Server Connections Exhausted
Redis has reached its maxclients limit and is rejecting new connection attempts, causing connection refused errors in upstream services. Redis enforces a maximum number of simultaneous client connections via the maxclients configuration parameter, and when this limit is reached new connection attempts are immediately rejected with "ERR max number of clients reached," causing upstream services to receive connection errors and fail their Redis-dependent operations. Common causes include maxclients being set too low for the number of services connecting to the Redis instance, connection pool misconfiguration where pools do not release idle connections, sudden traffic spikes creating many short-lived connections without pooling, and connection leaks in application code.
Slow Consumer
The application is consuming messages slower than they are produced, creating a processing bottleneck. As unprocessed messages accumulate, the system experiences increased queue lag, potential memory pressure, and downstream congestion. This often indicates that one or more instances are unable to keep up due to resource constraints, inefficient processing logic, or external dependencies.
Slow Database Queries
The application is experiencing slow database queries that lead to downstream slow consumer behavior and potential resource starvation. This condition affects instance performance, particularly when query execution times become excessively long, degrading overall system responsiveness.
Slow Database Server Queries
Warehouse congestion in Snowflake occurs when the processing capacity is overwhelmed by incoming queries, causing a significant backlog. This leads to queries being queued at high rates, indicating that the system is struggling to process them in a timely manner. The resulting resource starvation further degrades performance.
Transaction ID Congested
In databases like PostgreSQL, transaction IDs are 32-bit integers that count the number of transactions performed. High utilization occurs when the counter nears its maximum value (~2 billion transactions), requiring a wraparound to continue operation. Failure to perform routine VACUUM operations can prevent the system from marking old XIDs as reusable.
Unauthorized Access
The application is receiving numerous "Unauthorized" status codes (typically HTTP 401) when trying to access another service. This prevents the application from successfully retrieving data or performing actions, potentially causing service disruptions or degraded functionality for end users.