Applications
Software programs designed to perform specific tasks or functions for end-users or other systems.
In the Causely user interface, these root causes appear under the corresponding application entity.
Access Throttled
The application is receiving HTTP 429 "Too Many Requests" responses, indicating that it has exceeded the rate limits set by the other service. This can cause degraded functionality, slow performance, or temporary service unavailability for end users. HTTP 429 errors are typically triggered when an API or service imposes rate limits to control the volume of incoming requests.
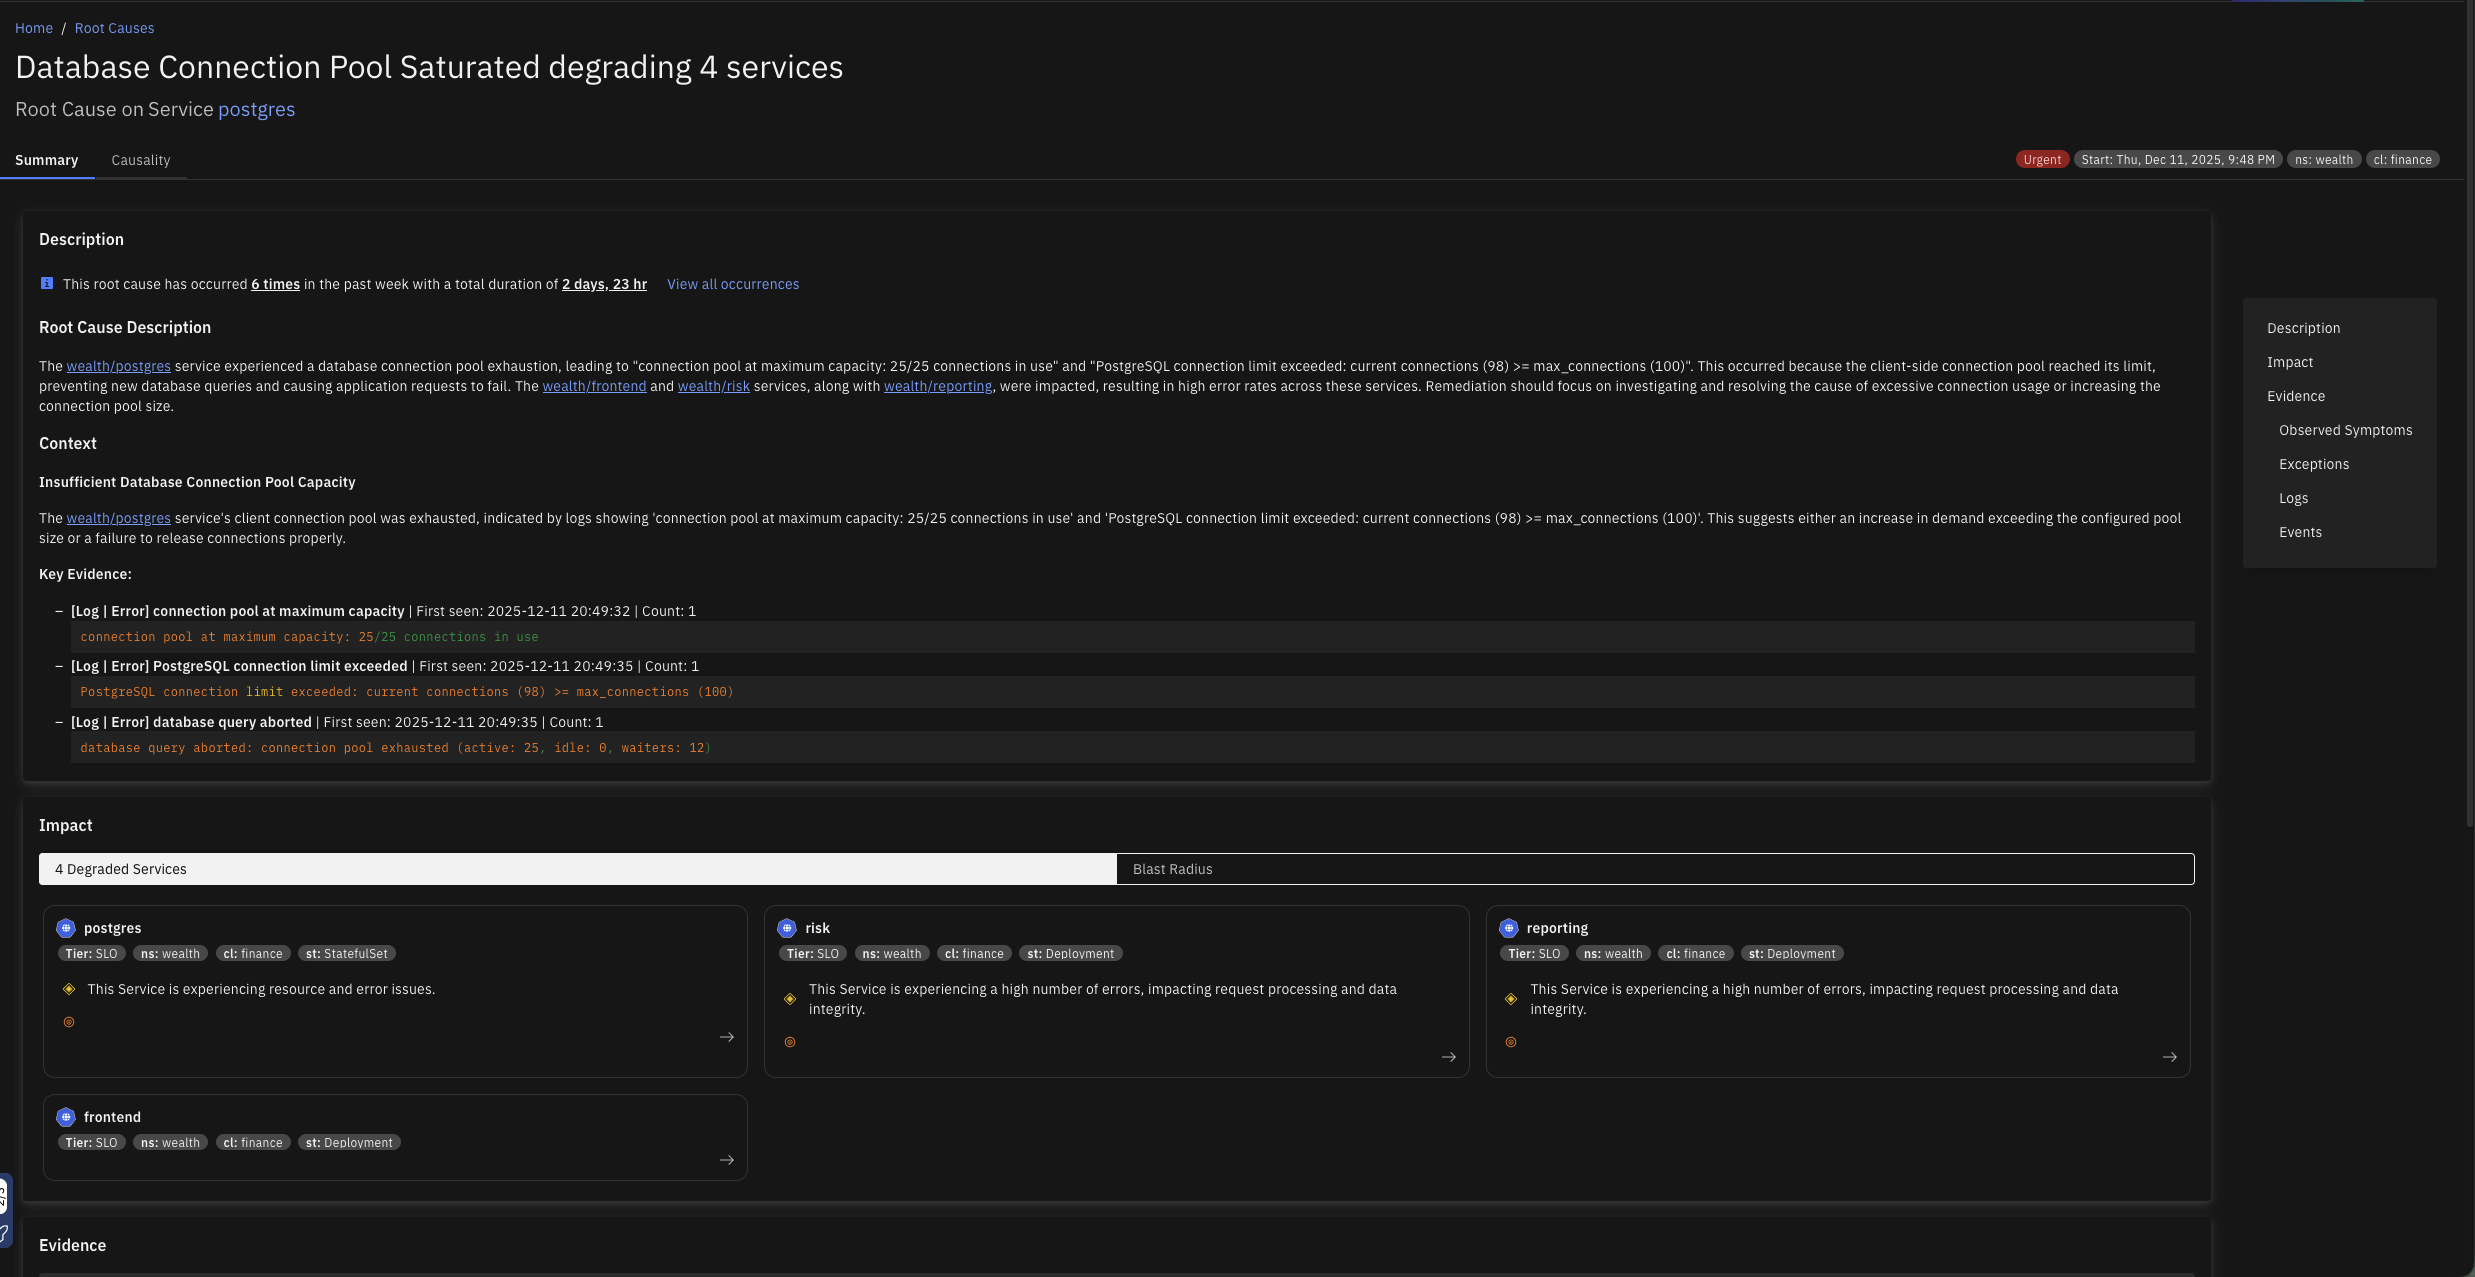
Database Connection Pool Saturated
The client-side database connection pool is exhausted when all available connections are in use, preventing new database queries from being executed. This can cause application requests to hang or fail, impacting user experience and potentially leading to downtime for database-dependent features.
Database Malfunction
The database is returning a high rate of errors or failing to respond to queries, causing disruptions for services and clients that depend on it. This may result in delayed or failed access to one or more tables, leading to degraded application performance, elevated latency, or complete unavailability of database-backed functionality.
Excessive DNS Traffic from Client
The application is generating an unusually high volume of DNS requests, potentially overwhelming DNS servers, increasing latency for users, and risking service disruptions. This behavior may also incur additional costs or trigger rate-limiting from DNS providers. This typically arises when the application initiates DNS lookups more frequently than necessary due to lack of effective caching, redundant DNS resolution logic, or misconfigurations.
File Descriptor Exhaustion
The application has reached the system-imposed limit on the number of file descriptors it can open. This typically leads to errors such as "Too many open files," preventing the application from creating new connections, reading files, or accessing resources. This can severely impact functionality, particularly in high-concurrency or high-I/O scenarios.
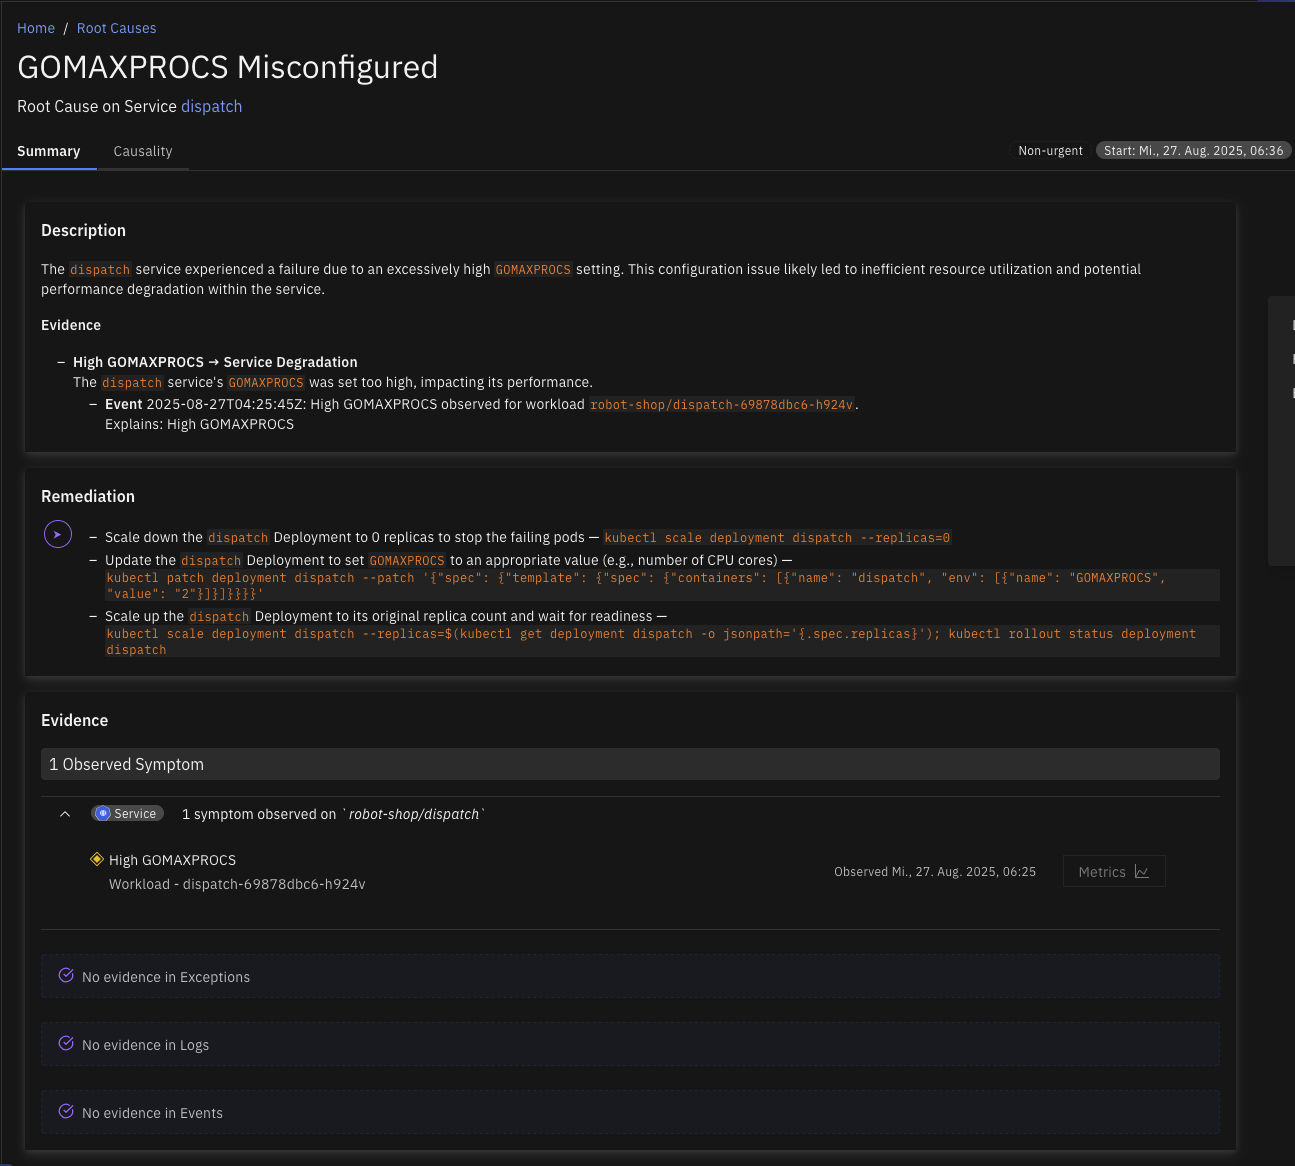
GOMAXPROCS Misconfigured
The environment variable GOMAXPROCS, which controls the maximum number of CPU cores the Go runtime uses, has been set higher than the CPU limit of the container in which the Go application is running. This mismatch can lead to inefficient CPU usage, reduced performance, and potential throttling because the Go runtime attempts to schedule more work than the container is permitted to handle.
Inefficient DNS Lookup
The application is making an unusually high volume of DNS requests, with over 80% returning NXDomain (non-existent domain) responses. This excessive DNS activity is adding 10 to 20 ms of latency to each request, negatively impacting service performance. The issue is often caused by the service or application attempting to resolve incomplete or unqualified domain names.
Inefficient Garbage Collection
The application is experiencing high latency and reduced throughput because a significant portion of its runtime is being spent in garbage collection (GC). This leads to frequent pauses, degrading overall performance and causing delays in request handling through all the dependent services. This issue usually occurs when the Java Virtual Machine (JVM) or other garbage-collected runtime environments are under memory pressure.
Invalid Client Certificate
The application is failing to connect to a service due to invalid certificate errors, preventing secure communication over HTTPS or TLS. This can cause downtime or degraded functionality for users relying on this service.
Java Heap Saturated
The JVM is operating with limited available heap memory, resulting in degraded performance or potential application crashes. This condition typically leads to frequent or prolonged garbage collection (GC) pauses, slow response times, and, in severe cases, OutOfMemoryError. It often reflects memory leaks, improper heap sizing, or excessive object allocation.
Lock Contention
The application suffers from inefficient locking, where suboptimal lock management leads to excessive contention and prolonged mutex wait times. This inefficiency degrades performance by increasing the risk of thread starvation under heavy load. This can stem from overuse of locks, coarse-grained locking strategies, or improper lock design.
Memory Exhaustion
The Broker application has exhausted its available memory, resulting in degraded performance and potential service disruption. When memory usage reaches critical levels, the system may experience increased garbage collection (GC) activity, higher processing latency, and, in severe cases, OutOfMemoryError events that halt message processing.
Noisy Client
The application acts as a Noisy Client, generating high number of requests that burden destination services with increased load and elevated request rates. This aggressive request pattern directly impacts destination services by driving a high request rate that can overwhelm service capacity and contributing to increased load on the destination.
Redis Connection Pool Saturated
Client-side Redis connection pool exhaustion occurs when all available connections in the pool are in use, preventing new requests to Redis. This can lead to request timeouts or failures, causing application disruptions for features relying on Redis for caching, messaging, or other operations.
Producer Publish Rate Spike
The application is publishing messages at a rate significantly higher than normal, causing queue depth to grow and producer message rate to increase. This surge in publishing activity creates backpressure and can overwhelm downstream consumers. When the application experiences a producer publish rate spike, it generates messages at an abnormally high rate that exceeds the system's normal capacity, leading to queue depth growth and propagation of congestion to downstream destinations.
Slow Consumer
The application is consuming messages slower than they are produced, creating a processing bottleneck. As unprocessed messages accumulate, the system experiences increased queue lag, potential memory pressure, and downstream congestion. This often indicates that one or more instances are unable to keep up due to resource constraints, inefficient processing logic, or external dependencies.
Slow Database Queries
The application is experiencing slow database queries that lead to downstream slow consumer behavior and potential resource starvation. This condition affects instance performance, particularly when query execution times become excessively long, degrading overall system responsiveness.
Slow Database Server Queries
Warehouse congestion in Snowflake occurs when the processing capacity is overwhelmed by incoming queries, causing a significant backlog. This leads to queries being queued at high rates, indicating that the system is struggling to process them in a timely manner. The resulting resource starvation further degrades performance.
Transaction ID Congested
In databases like PostgreSQL, transaction IDs are 32-bit integers that count the number of transactions performed. High utilization occurs when the counter nears its maximum value (~2 billion transactions), requiring a wraparound to continue operation. Failure to perform routine VACUUM operations can prevent the system from marking old XIDs as reusable.
Unauthorized Access
The application is receiving numerous "Unauthorized" status codes (typically HTTP 401) when trying to access another service. This prevents the application from successfully retrieving data or performing actions, potentially causing service disruptions or degraded functionality for end users.