v1.0.118
March 3, 2026
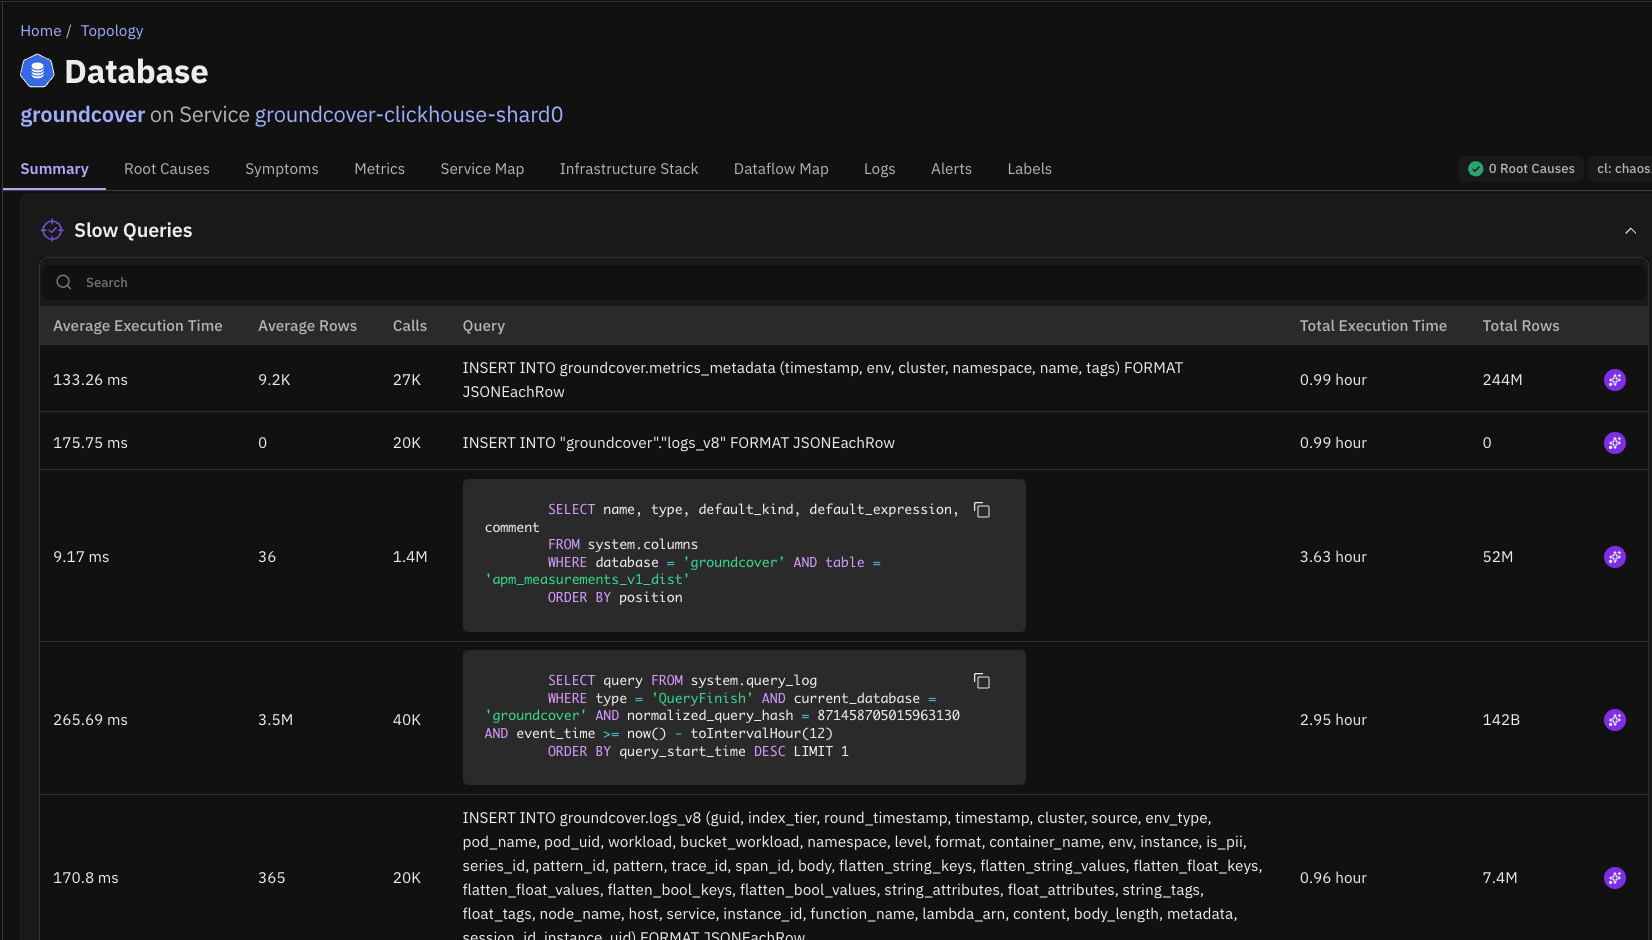
Version v1.0.118ClickHouse Support
Causely now supports ClickHouse as a telemetry source.
When ClickHouse is a critical component of your distributed system, this integration allows Causely to detect and surface issues in ClickHouse that may impact client services or overall application performance.
With ClickHouse telemetry integrated into the causal model, Causely can:
- Identify when ClickHouse is the root cause of service degradation, such as query latency, resource contention, or node issues
- Show which services and user-facing flows are affected when ClickHouse performance degrades
- Distinguish cause from symptom, helping teams determine whether an issue originates in ClickHouse or another service
Splunk Integration
Causely can now automatically surface error and warning logs from Splunk.
When Causely infers a root cause in your distributed application, relevant Splunk log entries are surfaced alongside the root cause.
Causely also reviews Kubernetes pod and container logs, surfacing any error or warning messages observed within the previous 24 hours to help engineers quickly understand what changed or failed around the time of the incident.
Beyla 3.0 Support
Causely now supports Beyla 3.0, enabling expanded auto-instrumentation capabilities.
This release improves visibility into encrypted communication between Java services and common data infrastructure components, including:
- Kafka
- PostgreSQL
- CockroachDB
This allows Causely to observe and model interactions that were previously difficult to capture due to encrypted connections. This additional auto-instrumentation is not enabled by default.
Minor Improvements
- Improved Alert Mapping: Expanded the types of alerts that automatically map to entities and symptoms, improving the accuracy and usefulness of root cause analysis.
- Extended Alert History: Alert history retention has been extended to 24 hours, allowing teams to review which alerts fired and understand the root causes associated with them.
- Improved Alert History View: The Alert History view now deduplicates alerts that fire repeatedly over the same time window. This makes it easier to understand alert frequency and recurring patterns.
- Alert Search and Filtering: Improved search and filtering capabilities within the alert history view, including searching by alert name and filtering by alert state (for example firing or pending).
- Dataflow Graph Improvements: Improvements to the dataflow graph make it easier to understand data movement across services, particularly in environments with multiple hops or complex service chains.