
Connect Telemetry Sources for Causal Analysis

Traces Are Essential

Causely requires traces to discover service dependencies and perform effective causal analysis. Without traces, the platform's ability to provide value is severely limited. Search for sources that provide Traces to ensure you have comprehensive trace coverage.

UI-based configuration​

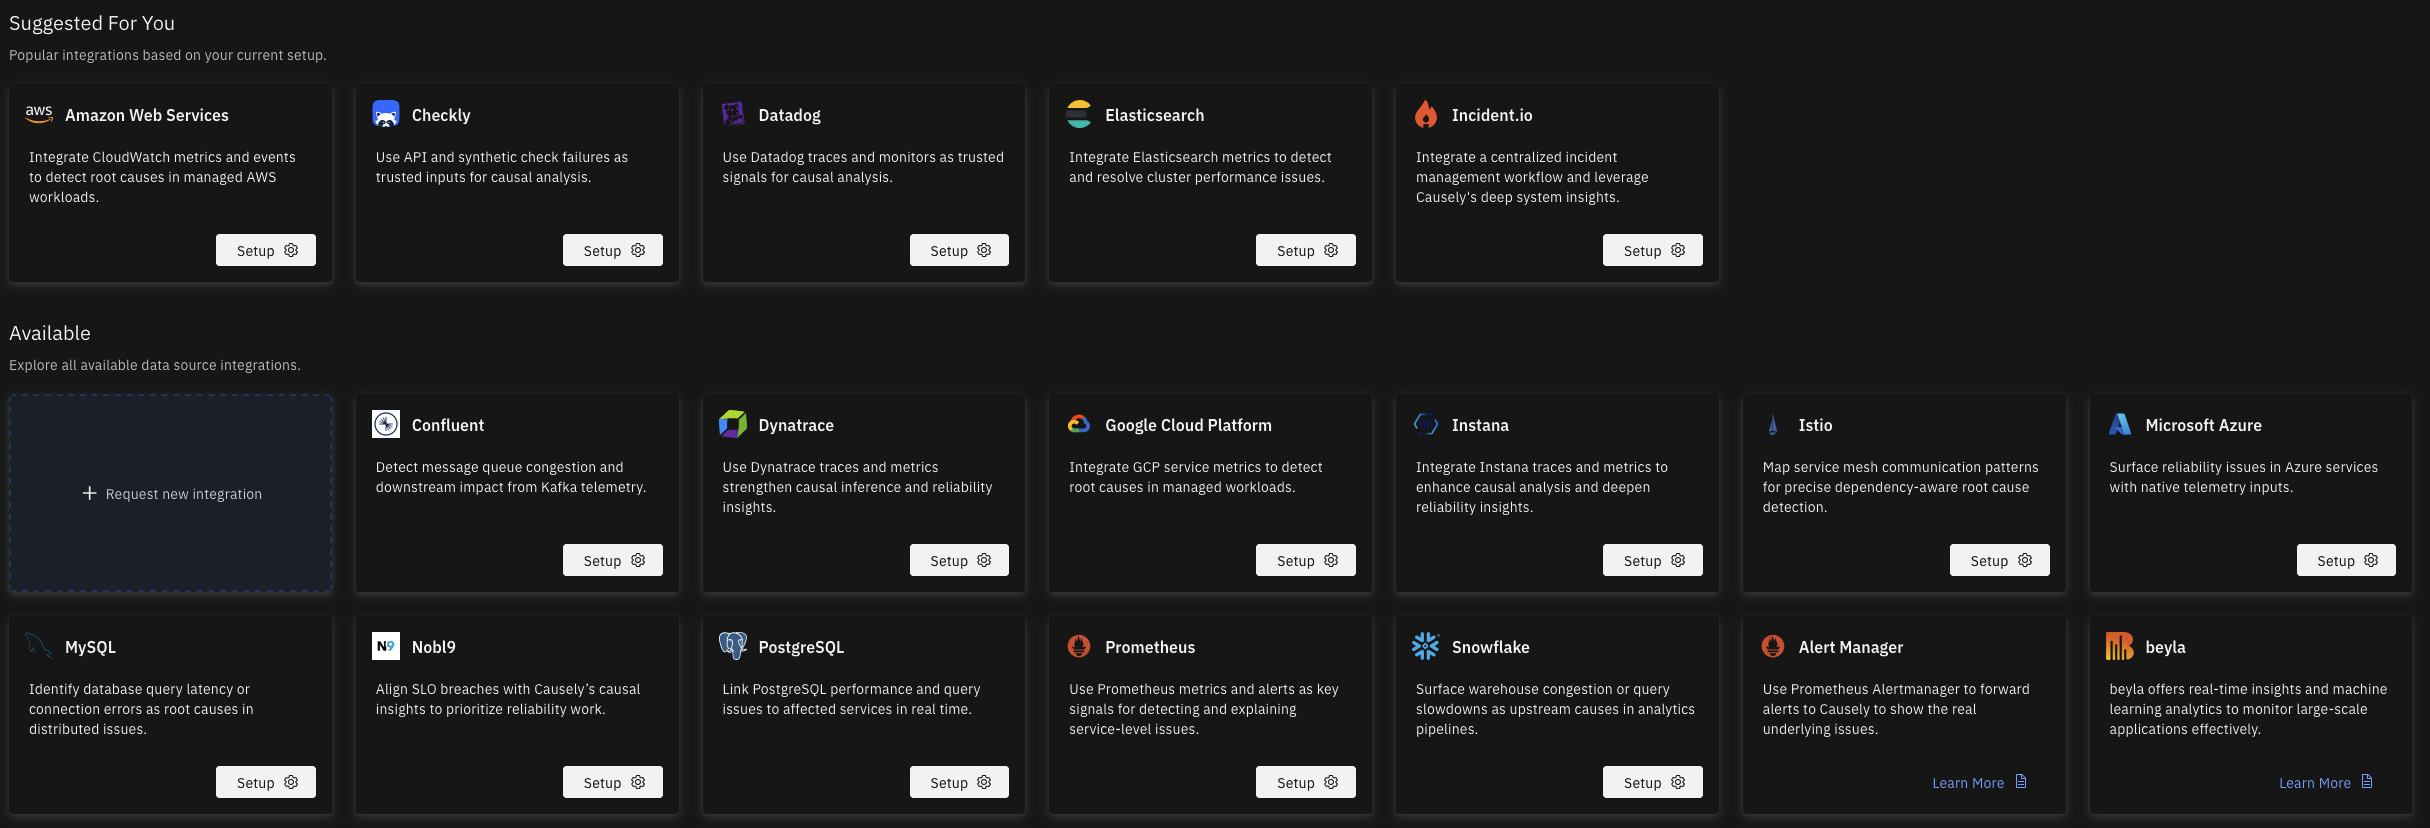
You can configure telemetry sources from the UI. Navigate to https://portal.causely.app/integrations to set up the integrations you need. You can then select the Mediator to which the configuration will be pushed down.

Available Telemetry Sources
tip

Missing a telemetry source? On that same page, click on + Request a new integration to file a request to add the integration you need.

To ensure that Causely can reason over a wide range of symptoms and causes, that explain those symptoms, in your environment, it is recommended that you configure additional data sources if they are available.

Telemetry sources are organized into categories based on their purpose and the types of inputs they provide to Causely's causal reasoning engine.

Signal Types​

Different telemetry sources provide different types of signals to Causely's causal reasoning engine:

  • Infrastructure Entities: Complete infrastructure topology including compute, storage, and networking resources
  • Logs: Application and container logs for correlation with root causes
  • Metrics: Performance metrics from applications and infrastructure
  • Service Discovery: Automatic discovery of services, workloads, and infrastructure components
  • SLOs: Service Level Objectives and reliability metrics
  • Symptoms: Automatic symptom detection from metrics, traces, and external monitoring systems
  • Traces: Distributed traces for service dependency discovery and communication monitoring

Telemetry Sources by Categories​

Infrastructure Scraper​

Discovers infrastructure resources such as VMs, containers, clusters, databases, load balancers, queues, and disks. It imports their topology, metadata, and health indicators, forming the backbone of Causely's environment-specific model for causal mapping of infrastructure-level failure modes.

Inputs Provided to Causely: Metrics, Infrastructure Entities, Symptoms, sometimes Service Discovery, sometimes Logs

AWS Managed Services
Integrate CloudWatch metrics and events to infer causes in managed AWS workloads.Signals: Infrastructure Entities, Metrics, Service Discovery, Symptoms
Azure Managed Services
Surface reliability issues in Azure services with native telemetry inputs.Signals: Infrastructure Entities, Metrics, Service Discovery, Symptoms
Docker
Map container-level health and resource metrics to their upstream service dependencies.Signals: Infrastructure Entities, Logs, Metrics, Service Discovery, Symptoms
GCP Managed Services
Integrate GCP service metrics to infer causes in managed workloads.Signals: Infrastructure Entities, Logs, Metrics, Service Discovery, Symptoms
Kubernetes
Map pod-level health and resource metrics to their upstream service dependencies.Signals: Infrastructure Entities, Logs, Metrics, Service Discovery, Symptoms
Nomad
Map task-level health and resource metrics to their upstream service dependencies.Signals: Infrastructure Entities, Logs, Metrics, Service Discovery, Symptoms

Logs​

Ingests log-derived signals (errors, exceptions, warnings) used for enhanced descriptions and remediation after a root cause has been inferred.

Inputs Provided to Causely: Logs

Metrics & Symptoms​

Provides quantitative telemetry (latency, saturation, throughput, resource usage) and domain-specific metrics (for example, Redis, RabbitMQ). These signals populate Causely's Attribute Dependency Graph, enabling reasoning about performance degradation and failure symptom chains.

Inputs Provided to Causely: Metrics, Symptoms

Middleware​

Connects Causely to critical data systems (for example, databases, caches, search systems, and message queues). These integrations pull topology, performance attributes, and state indicators to reveal bottlenecks and root causes within data infrastructure.

Inputs Provided to Causely: Metrics, Infrastructure Entities, Symptoms

Service Communication​

Provides traces and metrics through standard OTEL-based data pipelines (eBPF, Collectors, dual-shipping from Datadog, Odigos, groundcover, etc.). These sources enrich Causely's service graph and enable call-level causal reasoning.

Inputs Provided to Causely: Traces, Metrics, Symptoms

C++
Capture detailed performance traces from high-performance systems to improve causal inference precision.Signals: Metrics, Symptoms, Traces
Datadog
Use Datadog traces and monitors as trusted signals for causal analysis.Signals: Metrics, Symptoms, Traces
Dynatrace
Use Dynatrace traces and metrics to strengthen causal inference and reliability insights.Signals: Metrics, Symptoms, Traces
eBPF
Capture kernel-level dependencies and performance signals without modifying code.Signals: Metrics, Symptoms, Traces
Groundcover
Combine high-fidelity eBPF data with Causely's analytics.Signals: Metrics, Symptoms, Traces
Instana
Integrate Instana traces and metrics to enhance causal analysis and deepen reliability insights.Signals: Metrics, Symptoms, Traces
Istio
Map service mesh communication patterns for precise dependency-aware causal inference.Signals: Metrics, Traces
Odigos
Automatically instrument services with OpenTelemetry and feed traces into Causely's engine.Signals: Metrics, Symptoms, Traces
OpenTelemetry
Enable automatic discovery of service dependencies across both synchronous and asynchronous communications.Signals: Metrics, Symptoms, Traces

SLO Providers​

Supplies SLO (Service Level Objective) definitions and burn rate information (for example, from Nobl9). Causely uses SLOs as high-priority symptoms and impact indicators in causal reasoning.

Inputs Provided to Causely: SLOs

Symptom Activation​

Allows Causely to treat external alert triggers (for example, from Datadog Monitors, Checkly, Alertmanager) as explicit symptoms within the causal graph. This helps Causely analyze "why this alert fired" and resolve noisy or ambiguous alerts.

Inputs Provided to Causely: Symptoms

Search and Filter Telemetry Sources​

To search and filter telemetry sources by name, category, or signal type, go to the Supported Technologies page.