Application Instrumentation
Overview
- Metrics - Performance metrics from applications and infrastructure
- Signals - Automatic Signal detection from metrics, traces, and external monitoring systems
- Traces - Distributed traces for service dependency discovery and communication monitoring
Causely provides comprehensive observability and causal reasoning for applications written in various programming languages by leveraging industry-standard telemetry collection frameworks like Prometheus and OpenTelemetry. This approach ensures that regardless of your application's programming language, Causely can transform high-volume observability signals into real-time, explainable insights about performance, resource utilization, and potential issues.
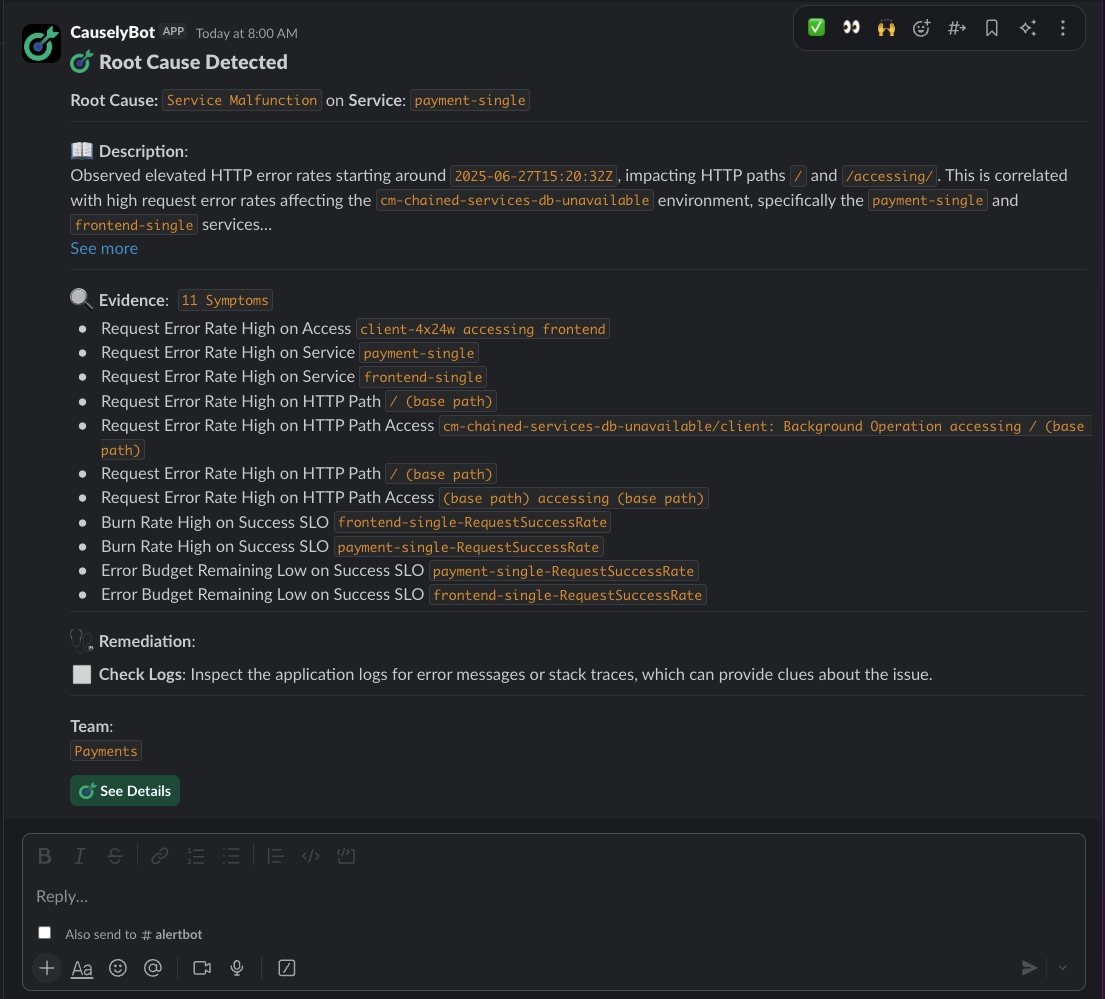
Instead of just monitoring Signals, Causely analyzes them in real time to surface the actual Diagnosis behind application issues.
By setting up the application languages integration, you will be able to do the following:
-
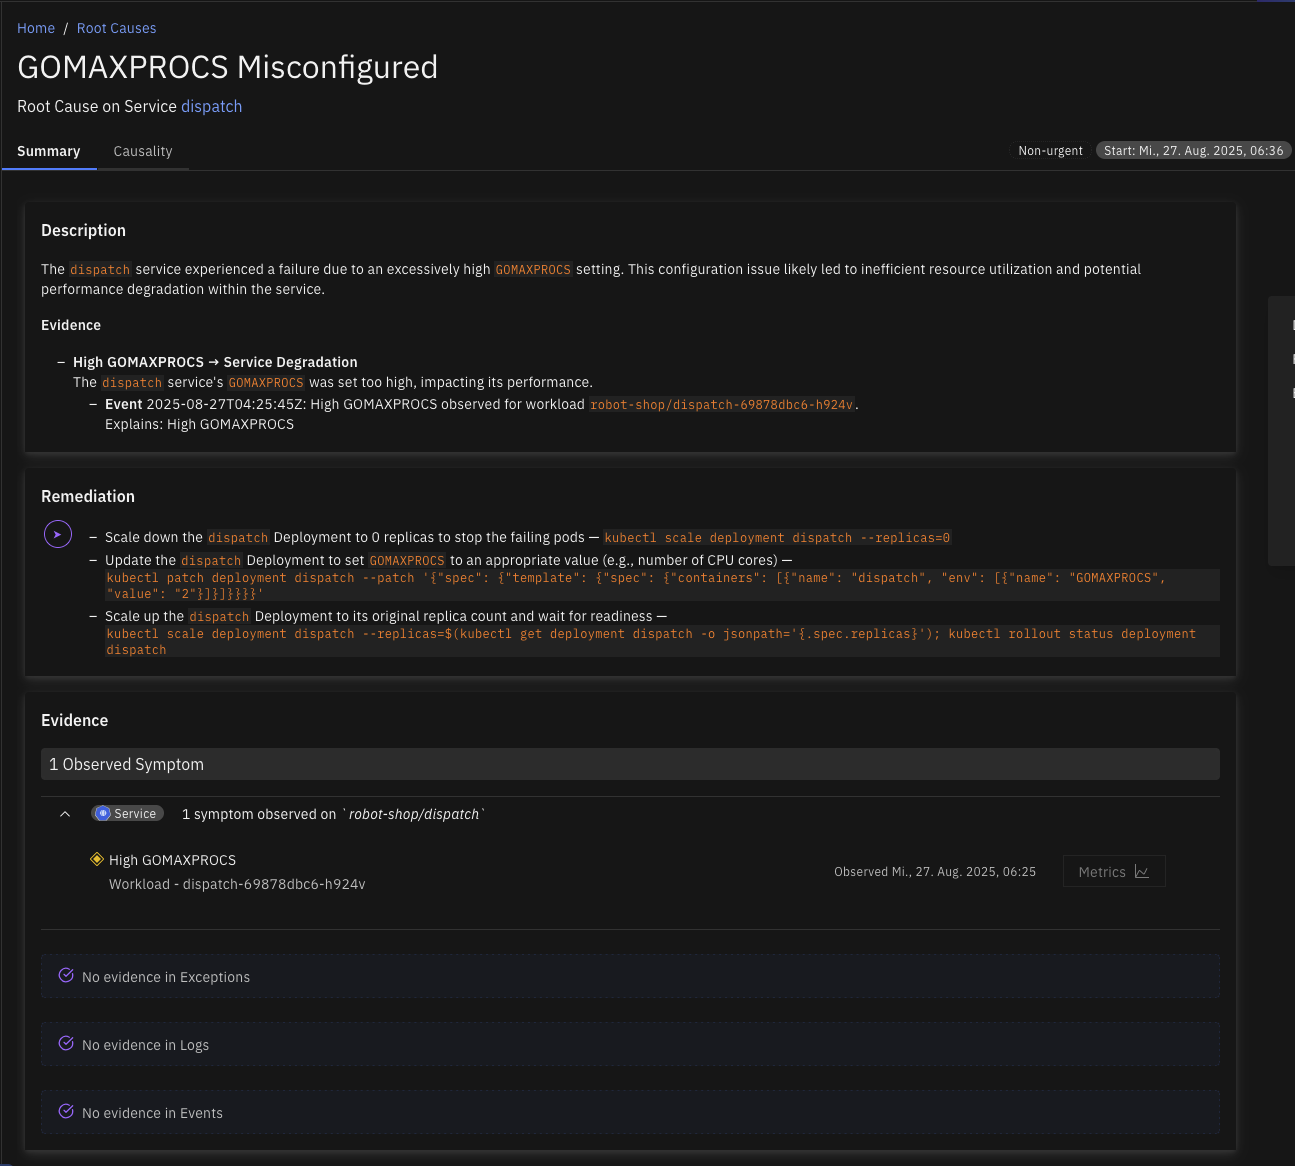
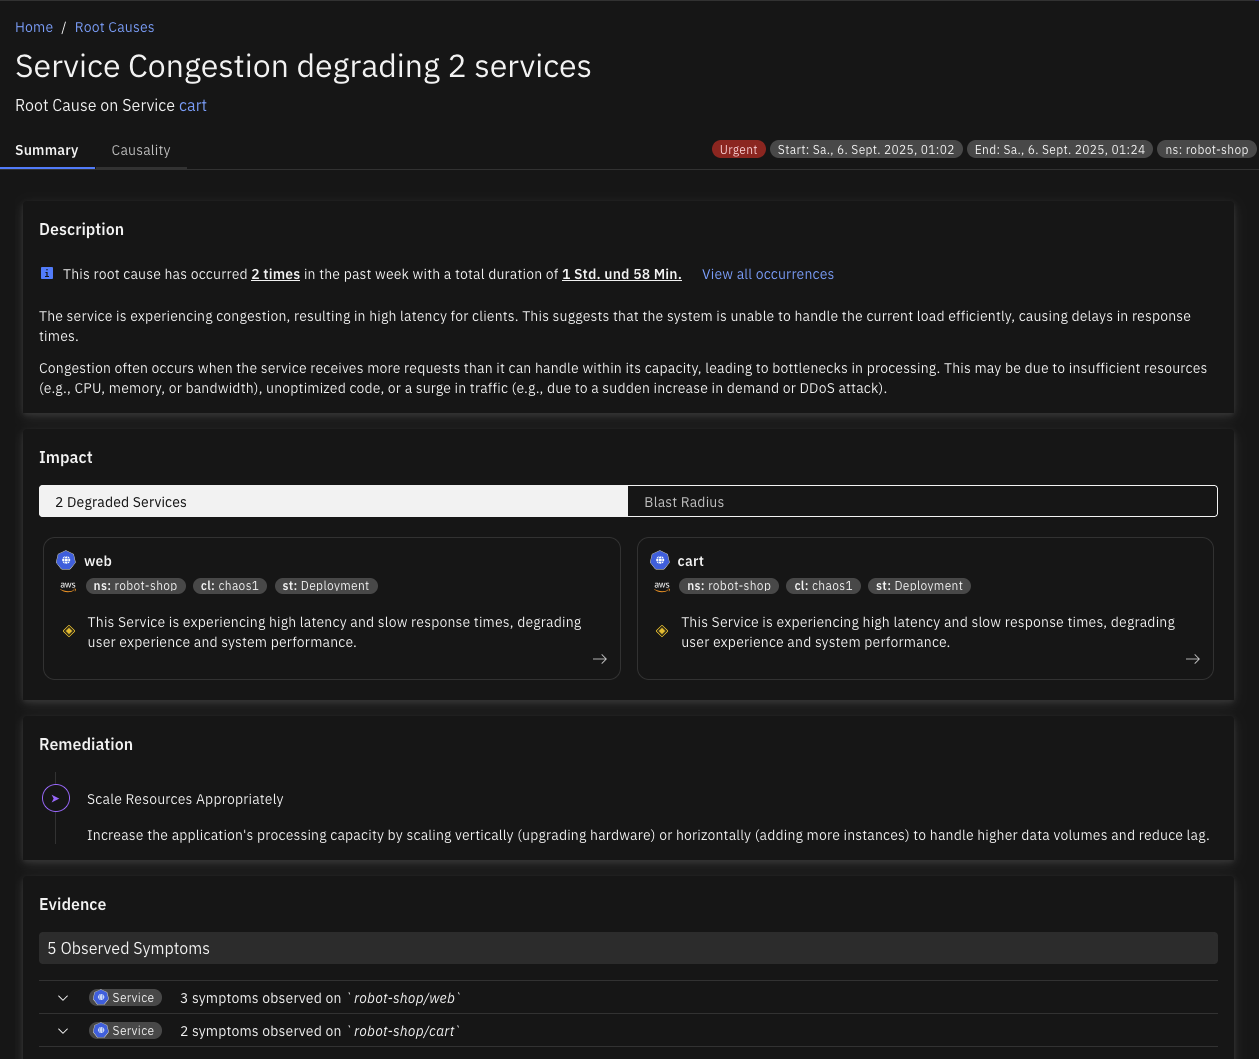
Identify causes for reliability issues originating from your application, including:
-
Language-specific causal reasons, including:
-
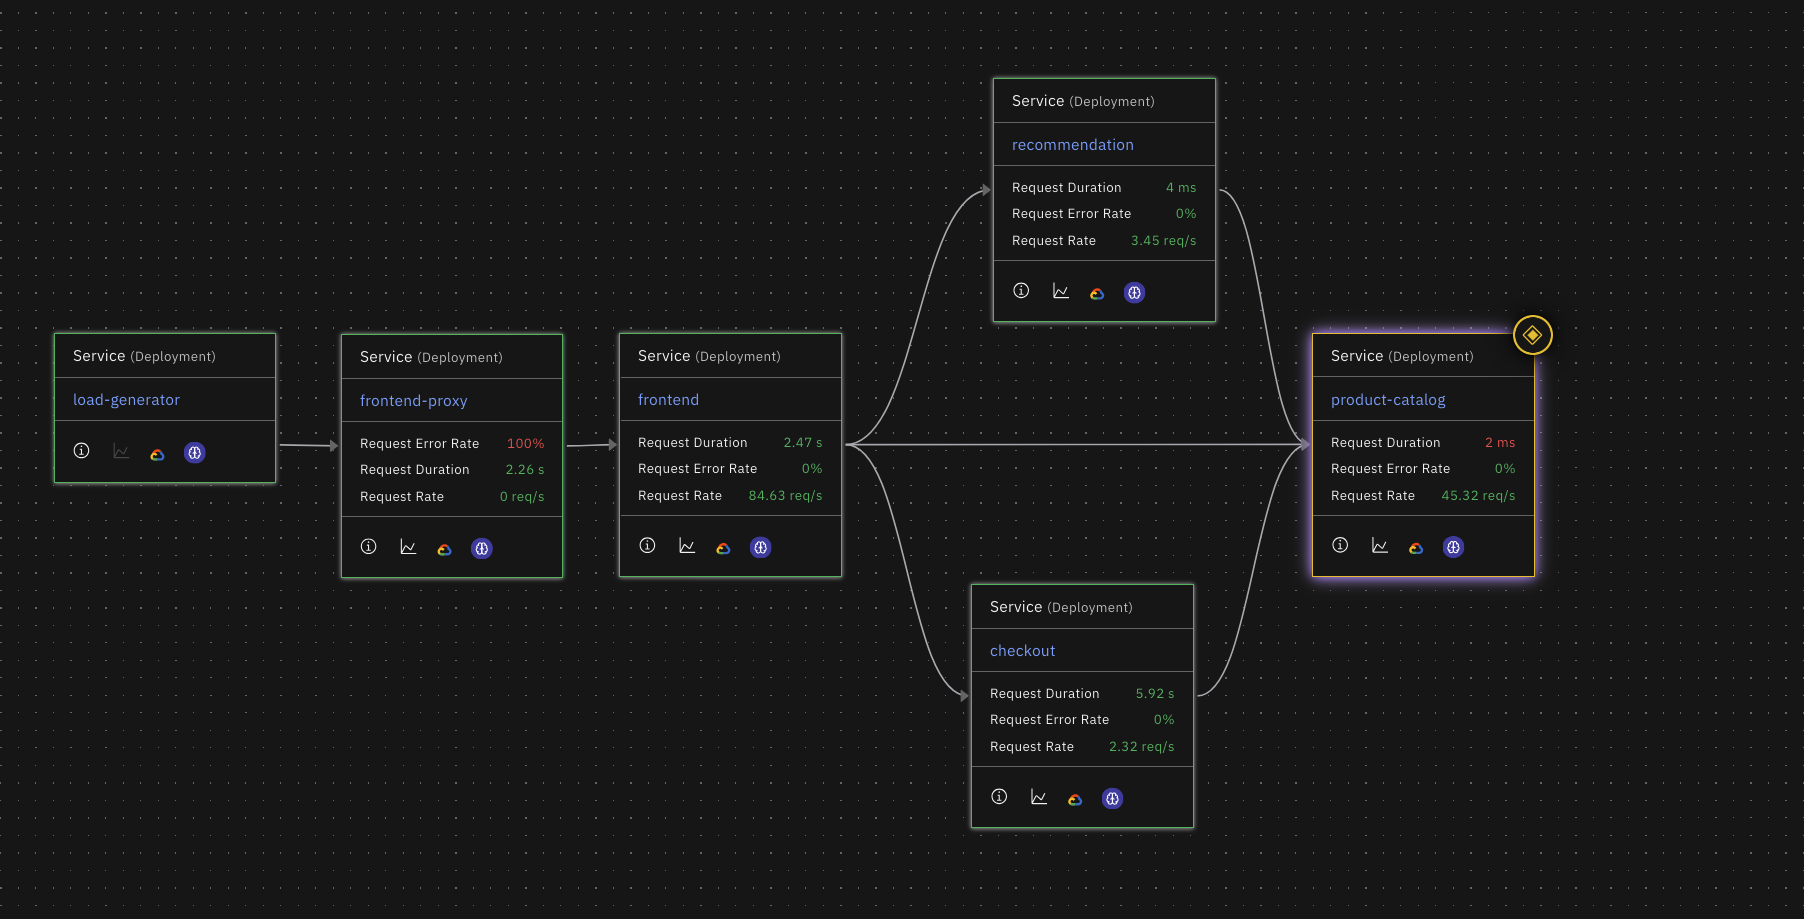
Observe the application as an entity in the Topology Graph, including it's relationships to other entities on the service map, infrastructure stack and dataflow map.
Language Support
Causely provides automatic, zero-code instrumentation for most applications using eBPF-based automatic instrumentation. This works out-of-the-box for most applications and provides comprehensive trace coverage.
For application that are already instrumented using OpenTelemetry, Causely can collect telemetry from them using the OpenTelemetry Collector.
This way Causely can provide comprehensive observability and causal reasoning for applications written in any language, including the following:
- C++
- C#/.NET
- Erlang/Elixir
- Go
- Java
- JavaScript
- PHP
- Python
- Ruby
- Rust
- Swift
OpenTelemetry and Prometheus are open source standards and by that can be implemented by any language. This means that as long as support for your language is available, Causely can collect telemetry from it.