Thresholds for Service Symptoms
Causely detects service and infrastructure symptoms based on a wide range of metrics, using a combination of defaults and learned behavior. However, you may want to customize these thresholds to better match your specific requirements and SLO definitions. This document explains how to configure custom thresholds for your services.
Overview
Causely uses thresholds to detect service and infrastructure symptoms across a wide range of metrics, including latency, error rates, throughput, and resource utilization.
These thresholds serve two related purposes:
- Symptom detection, where crossing a threshold activates a Causely issue or risk
- SLO evaluation, where the same metrics act as Service Level Indicators (SLIs) that determine SLO health
Causely provides sensible defaults for all supported thresholds. For some metrics, Causely can also learn thresholds automatically based on historical and real-time behavior. You can optionally configure manual thresholds or tune learned thresholds to better reflect business requirements, reliability targets, or known system constraints.
Key Concepts
Threshold Sources
Each threshold in Causely has a source, which determines how its value is set and maintained:
-
Default
A system-provided threshold value that applies when no learning or manual override is configured. Defaults are designed to be safe and broadly applicable. -
Learned
For some metrics, Causely can automatically learn a threshold based on historical and real-time behavior. Learned thresholds adapt over time as normal behavior changes. -
Manual
A user-configured threshold that explicitly overrides the default or learned value. Manual thresholds remain fixed until changed or removed.
Only one source is active for a given threshold at any time (minimum learned thresholds do not change the source).
How Thresholds Are Evaluated
Thresholds are always evaluated against a specific metric and aggregation, even when multiple series are shown for context.
For example:
- Request Duration thresholds are evaluated against P95 latency
A symptom becomes active when the P95 latency exceeds the configured threshold. - Other percentiles (such as P90 or P99) may be displayed to provide additional context but do not drive activation.
The evaluation aggregation is fixed per metric and does not change when thresholds are overridden.
Learned Threshold Minimums
For metrics that support learning, you can optionally configure a Minimum Learned Threshold.
A minimum learned threshold:
- Sets a lower bound on how low a learned threshold can go
- Allows Causely to continue learning above that value
- Does not create a manual override
This is useful when you want adaptive behavior while preventing learned thresholds from becoming unrealistically low due to traffic patterns or short-term anomalies.
Thresholds and SLOs
The same metrics used for symptom detection are also used as Service Level Indicators (SLIs) when evaluating SLOs.
This means:
- A threshold crossing may activate a symptom
- The same metric contributes to SLO health calculations
Configuring thresholds affects both operational detection and SLO evaluation, so changes should be made with awareness of their broader impact.
How to Configure Thresholds
Causely supports configuring thresholds through multiple mechanisms, allowing you to choose the approach that best fits your workflow and environment. Regardless of the method used, the outcome is the same: a manual threshold, unless you configure a minimum learned threshold.
Thresholds can be configured at different levels (for example, service, workload, or infrastructure resource), depending on the metric and entity type.
Configuration Options
You can configure thresholds using the following methods:
-
Causely UI
Best for inspecting learned behavior, understanding how thresholds relate to observed metrics, and making targeted adjustments. -
Service metadata
Service metadata supports configuring a subset of commonly used service-level thresholds and allows you to configure thresholds declaratively using:- Kubernetes labels
- Nomad service tags
- Consul service metadata
This approach is well suited for version-controlled, environment-specific configuration that travels with your service definition.
-
Causely API
Best for programmatic configuration, automation, and integration with internal tooling or workflows.
All configuration methods support configuring manual thresholds where applicable, and for metrics that support learning, configuring a minimum learned threshold to bound adaptive learning.
Choosing the Right Method
Use the UI when you want to:
- understand why a symptom is activating,
- compare learned thresholds against real traffic,
- experiment or iterate quickly.
Use service metadata when you want to:
- manage thresholds as code,
- apply consistent thresholds across environments,
- ensure thresholds are applied automatically during deployment.
Use the API when you want to:
- automate threshold management,
- integrate threshold changes into CI/CD or internal systems,
- apply changes across many entities programmatically.
What Happens When You Configure a Threshold
When you configure a threshold:
- The threshold source becomes Manual
- Automatic learning (if supported for that metric) is paused
- The configured value is used consistently for:
- symptom activation
- SLI evaluation for SLOs
If you remove a manual threshold, Causely reverts to the default or learned threshold, depending on the metric.
Minimum Learned Thresholds
For metrics that support learning, you can optionally configure a Minimum Learned Threshold instead of a full manual override.
This allows Causely to:
- continue adapting to changing behavior,
- while never learning a threshold below the configured minimum.
Minimum learned thresholds do not replace learning and do not create a manual override.
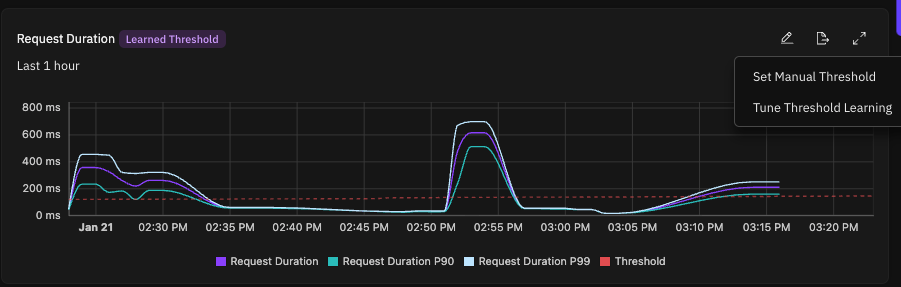
Using the Causely UI
Using the UI allows you to:
- Inspect the learned threshold alongside observed metrics (for example P90 and P99 for latency)
- Override thresholds to match documented SLOs or performance requirements
- Set a minimum value that bounds how low a learned threshold can go while preserving adaptive learning
- Immediately see how a custom threshold compares to real traffic patterns
To configure thresholds in the UI:
- Navigate to the service you want to configure.
- Select the Metrics tab for the service, then select the relevant symptom metric (for example, Request Duration or Request Error Rate).
- Click the pencil icon next to the threshold to edit the value.
- Save the change to apply the override. UI-based configuration is best suited for teams that want quick iteration, visibility into learned behavior, and explicit control without modifying service metadata or deployment configuration.
Using Service Metadata
Not all thresholds can be configured via service metadata. Metadata-based configuration currently supports a subset of service-level thresholds such as request error rate and request latency.
Using Kubernetes Labels
The recommended way to configure thresholds is using Kubernetes labels. You can apply these labels to your services:
# Configure error rate threshold (for example, 1% error rate)
kubectl label svc -n <namespace> <service-name> "causely.ai/error-rate-threshold=0.01"

# Configure latency threshold (for example, 500ms)
kubectl label svc -n <namespace> <service-name> "causely.ai/latency-threshold=500.0"
Using Nomad Service Tags
For Nomad services, you can configure thresholds using service tags in your job specification:
job "example" {
  group "app" {
    service {
      name = "my-service"
      port = 8080

      tags = [
        "causely.ai/error-rate-threshold=0.01"
        "causely.ai/latency-threshold=500.0"
      ]
    }
  }
}
Using Consul Service Metadata
For Consul services, you can configure thresholds using service metadata:
# Register a service with threshold metadata
consul services register \
  -name="my-service" \
  -port=8080 \
  -meta="causely.ai/error-rate-threshold=0.01" \
  -meta="causely.ai/latency-threshold=500.0"

# Update existing service metadata
consul services register \
  -id="my-service-id" \
  -name="my-service" \
  -port=8080 \
  -meta="causely.ai/error-rate-threshold=0.01" \
  -meta="causely.ai/latency-activation-delay=500.0"
Supported Thresholds
Causely supports configurable thresholds across a broad set of service and infrastructure entities. These thresholds are used to detect symptoms and also act as Service Level Indicators (SLIs) when evaluating SLO health.
Some thresholds support automatically learned values, while others use system defaults that can be manually overridden.
Services, Workloads, HTTP Paths and RPC Methods
| Metric | Unit | Learned |
|---|---|---|
| Request Error Rate | percent | No |
| Request Duration (P95) | millisecond | Yes |
| Request Duration P95 (Client) | millisecond | Yes |
| Request Rate | request/s | Yes |
| Connections | percent | No |
| Mutex Wait Time | percent | No |
| Command Latency | millisecond | No |
| GC Time | percent | No |
| Queries Queued | count | No |
| Transaction Error | percent | No |
| Transaction Duration | second | No |
| Transaction IDs Congested | percent | No |
| Cache Size | bytes | No |
| Redis Connections Utilization | percent | No |
| Kafka Message Rate | message/s | No |
| Server Errors | count | No |
| User Errors | count | No |
| File Descriptor Utilization | percent | No |
| Java Heap Utilization | percent | No |
| Throttled | count | No |
| DB Connections Utilization | percent | No |
Queues, Topics and Background Operations
| Metric | Unit | Learned |
|---|---|---|
| Queue Depth | count | No |
| Dead Letter Count | count | No |
| Queue Acks | request/s | No |
| Message Wait Time | seconds | No |
| Queue Size Bytes | bytes | No |
| Lag | count | No |
| Task Duration | millisecond | No |
Database Tables
| Metric | Unit | Learned |
|---|---|---|
| DB Query Duration | second | Yes |
| Select Query Duration (P95) | millisecond | Yes |
| Table Bloat | percent | No |
| Lock Exclusive Rate | percent | No |
| DDL Lock Exclusive Rate | percent | No |
Application Load Balancers
| Metric | Unit | Learned |
|---|---|---|
| Request Rate | request/s | Yes |
| Request4xx Error | percent | No |
| Request5xx Error | percent | No |
| Request504 Error | percent | No |
| ELB Auth Error | count | No |
| Target Connection Error | count | No |
Containers and Controllers
| Metric | Unit | Learned |
|---|---|---|
| CPU Utilization | percent | No |
| CPU Throttled | percent | No |
| Memory Utilization | percent | No |
| Ephemeral Storage Utilization | percent | No |
| Frequent Crash | count | No |
| FrequentOOM Kill | count | No |
| Frequent Pod Ephemeral Storage Evictions | count | No |
Nodes and Virtual Machines
| Metric | Unit | Learned |
|---|---|---|
| CPU Utilization | percent | No |
| Memory Utilization | percent | No |
| Conntrack Table Utilization | percent | No |
| SNAT Port Utilization | percent | No |
| Container Ephemeral Storage Utilization | percent | No |
| Memory Pressure Pod Evictions | count | No |
| Disk Pressure Pod Evictions | count | No |
| Disk Read IOPS Utilization | percent | No |
| Disk Write IOPS Utilization | percent | No |
| Disk Total IOPS Utilization | percent | No |
| Disk Read Throughput Utilization | percent | No |
| Disk Write Throughput Utilization | percent | No |
| Disk Total Throughput Utilization | percent | No |
Disks
| Metric | Unit | Learned |
|---|---|---|
| Utilization | percent | No |
| Read IOPS Utilization | percent | No |
| Write IOPS Utilization | percent | No |
| Total IOPS Utilization | percent | No |
| Read Throughput Utilization | percent | No |
| Write Throughput Utilization | percent | No |
| Total Throughput Utilization | percent | No |
| Inodes Utilization | percent | No |
Best Practices
-
Start with Default or Learned Thresholds
Use Causely’s default or automatically learned thresholds as a baseline before introducing manual overrides. -
Override Only When There Is a Clear Requirement
Configure manual thresholds when you have explicit business, reliability, or compliance requirements that differ from observed behavior. -
Prefer Minimum Learned Thresholds Over Full Overrides
When available, use a minimum learned threshold to bound adaptive learning without disabling it entirely. -
Consider Both Symptom Detection and SLO Impact
Threshold changes affect both symptom activation and SLI evaluation for SLOs. Validate changes in both contexts. -
Monitor After Changes
After updating thresholds, observe how they affect symptom frequency, noise, and SLO evaluation over time. -
Document Intent, Not Just Values
Record why a threshold was changed to support future reviews and adjustments.
Example Use Cases
-
Strict SLO Requirements
A critical service requires tighter latency bounds than normal traffic patterns allow. A manual threshold is configured to align symptom detection and SLO evaluation with the defined objective. -
Preventing Overly Aggressive Learned Thresholds
A service with highly variable traffic uses a minimum learned threshold to prevent latency thresholds from adapting too low during off-peak periods while preserving adaptive behavior. -
Infrastructure Saturation Detection
A team configures CPU or disk utilization thresholds on nodes to detect resource saturation early, independent of application-level symptoms. -
Queue Backlog Monitoring
Queue depth and message wait time thresholds are configured to surface processing delays before they impact downstream services. -
Temporary Adjustments During Maintenance
Thresholds are temporarily adjusted during planned maintenance or migrations and reverted afterward.