Architecture
Causely is built on a split-architecture model that balances local control with a dedicated reasoning backend that can run in your cloud or Causely-managed infrastructure. This design keeps overhead low, keeps raw telemetry in your environment, and integrates with the tools you already run.
This page provides detailed information about Causely's deployment architecture and component structure. For a high-level overview of how Causely's causal reasoning engine works, see How Causely Works.
System Architecture
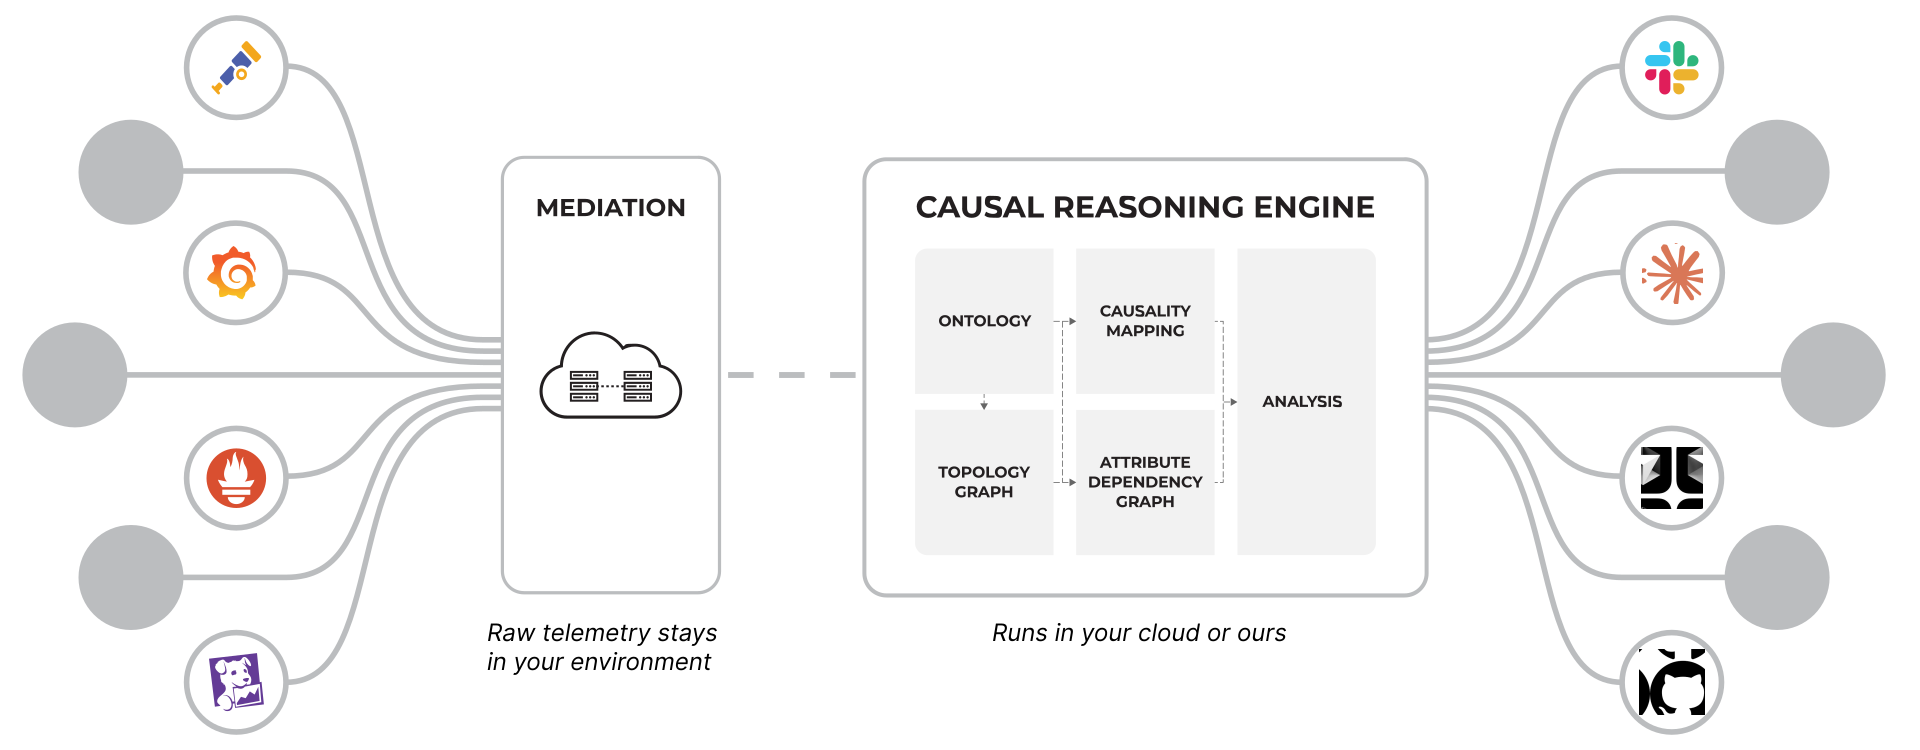
Deployment Architecture
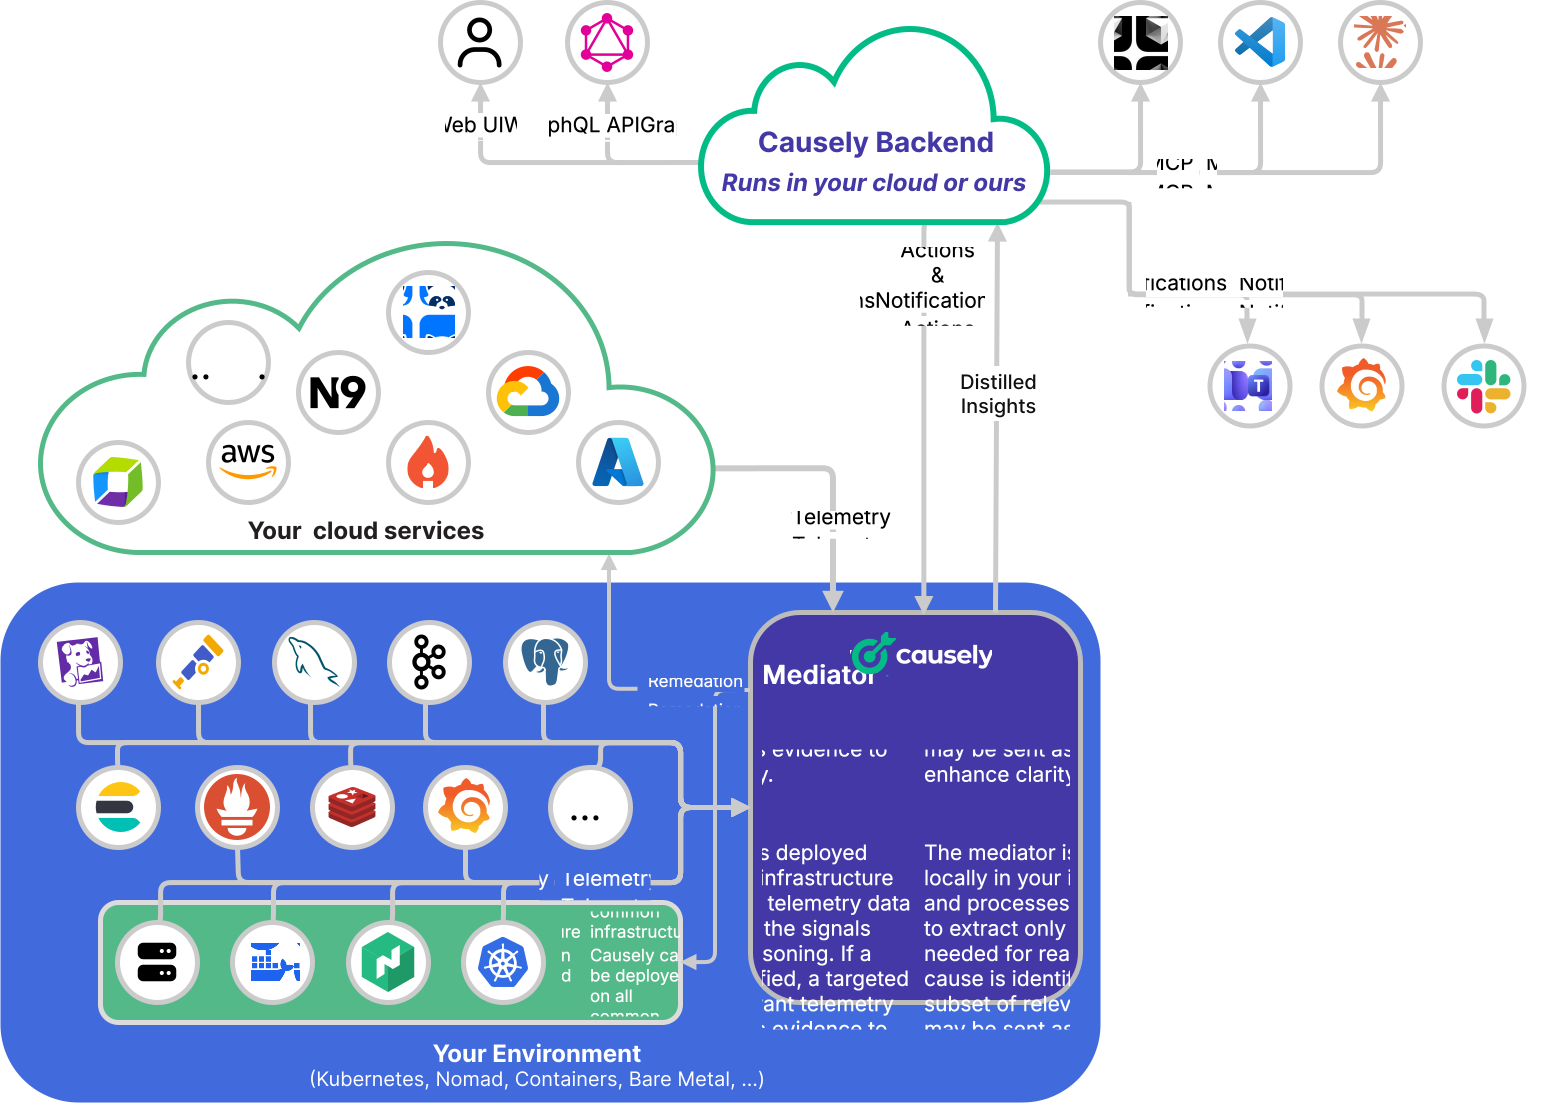
Causely can be deployed across various environments, including Kubernetes clusters, standalone Docker hosts, Nomad clusters, and more. The deployment architecture consists of several components that work together to provide a real-time Diagnosis.
Causely is designed for flexible deployment. The mediation layer and agents always run in your environment. The Causely backend (causal engine) can run in your cloud (BYOC) or in Causely-managed infrastructure.
Mediation Layer
The mediation layer is deployed locally in your infrastructure and processes telemetry data to extract only the signals needed for reasoning. It performs:
- Signal Detection: Converts telemetry from Prometheus, CloudWatch, Datadog, OpenTelemetry (including eBPF), and other sources into a binary stream of active/inactive signals.
- Topology Discovery and Ingestion: Leverages integrated telemetry sources to discover entities and dependencies and ingest topology from systems such as OpenTelemetry, cloud provider APIs and other sources.
- Local Processing: Processes telemetry locally to minimize data transfer, control cost, and ensure data stays within your environment. Most raw telemetry remains local, with only distilled insights and targeted evidence sent to the Causely backend (deployed in your cloud or Causely-managed) for analysis.
The mediation layer primarily sends distilled insights to the cloud. After a Diagnosis is made, a targeted subset of relevant telemetry (metrics, traces, and log-derived errors/events) may be sent as evidence to enhance its clarity. For more detail on supported telemetry sources, see Supported Telemetry.
The mediation layer consists of the following components:
Mediator
The Mediator is the core component that runs locally in your environment. It discovers your services, infrastructure and dependencies, receives OpenTelemetry data on port 4317, pulls from your existing telemetry sources, and evaluates signals locally. It sends the Causely backend (deployed in your cloud or Causely-managed) an abstract representation of your environment, plus targeted evidence after a Diagnosis is made.
For what the Mediator does with each type of telemetry, what leaves your environment, and how it scales, see Mediator Details.
Mediator memory scales with the number of entities under management, not with trace or metric throughput, and the Mediator works from a statistically significant sample of traces. See How it scales for details, and Sizing the Mediator for large environments for configuration.
Agents
Agents are deployed across your infrastructure to gather node and container level metrics. The deployment method varies depending on your environment:
- Kubernetes: Agents are deployed as a DaemonSet across all nodes in the cluster
- Docker: Agents run as containers on standalone Docker hosts
- Nomad: Agents are deployed as Nomad jobs across the cluster
Agents leverage eBPF technology, which requires privileged access to the host system. This enables automatic instrumentation without code changes. The eBPF instrumentation uses uprobes exclusively to intercept specific user-space functions within your applications. It does not hook into kernel networking callbacks or the packet datapath, and does not act as a Container Network Interface (CNI) or network infrastructure component. The instrumentation may inject trace context headers for distributed tracing, but does not intercept, block, or route network traffic at the kernel level.
Agents don't establish any outbound connections to the internet or any other service apart from the Mediator and VictoriaMetrics. The agents periodically forward the topology and manifestation data to the Mediator, which, in turn, sends it to the Causely backend for analysis (running in your cloud or Causely-managed). If an agent fails or is removed, your applications and network continue to function normally.
Agent Architecture
Executor
The Executor is an optional component responsible for executing remediation actions within your infrastructure. The Executor can be enabled as part of the deployment process.
The specific permissions required depend on your deployment environment:
- Kubernetes: The Executor's ServiceAccount is granted the
cluster-adminrole - Docker/Nomad: The Executor requires appropriate permissions to execute remediation actions
VictoriaMetrics
VictoriaMetrics is a timeseries database used by the agents and mediator (on port: 8428) to store additional timeseries data locally in your environment. If you observe gaps in metrics graphs, VictoriaMetrics may be under-resourced for your environment. See Sizing VictoriaMetrics for high-volume environments.
Causal Engine
The Causal Engine runs in the Causely backend, which can be deployed in your cloud or in Causely-managed infrastructure. It receives the stream of signal states and performs real-time analysis using probabilistic modeling, system graphs, and causal inference. It produces Diagnoses, evaluates blast radius, validates constraints, and prioritizes remediation, all without requiring manual correlation.
Telemetry Sources
Causely supports a wide range of telemetry sources, including OpenTelemetry, Prometheus, CloudWatch, Datadog, and more. For a full list of supported telemetry sources, see Supported Telemetry.
Causely Agents are deployed in your infrastructure and are responsible for collecting the telemetry data from those sources.
By default Causely will automatically instrument your applications to receive OpenTelemetry traces. This allows Causely to discover service dependencies, monitor sync and async communication signals. Additionally you can export traces to Causely from your existing OpenTelemetry Collectors. We recommend that you always send OpenTelemetry traces to Causely, as this allows Causely to provide cross-service insights.
Agent Integration
Causely exposes its causal model to AI agents via an MCP server. Any MCP-compatible agent, including Claude Code, Cursor, HolmesGPT, or a custom agent, gets deterministic access to root causes, service health, dependency maps, and blast radius.
Instead of reasoning over raw telemetry, agents query structured, causal system knowledge. This reduces token consumption, eliminates guesswork, and lets agents take action with auditable evidence.
For details on connecting agents to Causely, see Agent Integration.
Workflow Integration
Causely integrates directly into your tools of choice, delivering causal insights into Slack, Alertmanager, Opsgenie, Grafana, and more.
For details on how to connect Causely to your workflows, see Supported Workflows.
This architecture allows Causely to deliver precise, real-time insights without burdening your data pipelines or violating privacy requirements.
Security Considerations
For detailed information about security, permissions, and data handling, see the Security documentation.