Infrastructure
Servers or cloud resources to execute tasks, run applications, or perform calculations.
Overview
Compute Spec
CPU Congested
One or multiple containers in a workload are experiencing CPU congestion, leading to potential throttling. This occurs when the containers use more CPU resources than allocated, causing degraded performance, longer response times, or application crashes. CPU throttling occurs when a container exceeds its CPU quota as defined by Kubernetes or Docker.
Crash Failure
One or multiple containers of a workload has crashed with a non-zero exit code, indicating abnormal termination. This disrupts the application's functionality, leading to downtime or degraded performance depending on how the workload is designed. The non-zero exit code signifies an error during the execution of the container's process.
Frequent Crash Failure
One or multiple containers of a workload are frequently crashing with a non-zero exit code, indicating abnormal termination. This disrupts the application's functionality, leading to downtime or degraded performance depending on how the workload is designed.
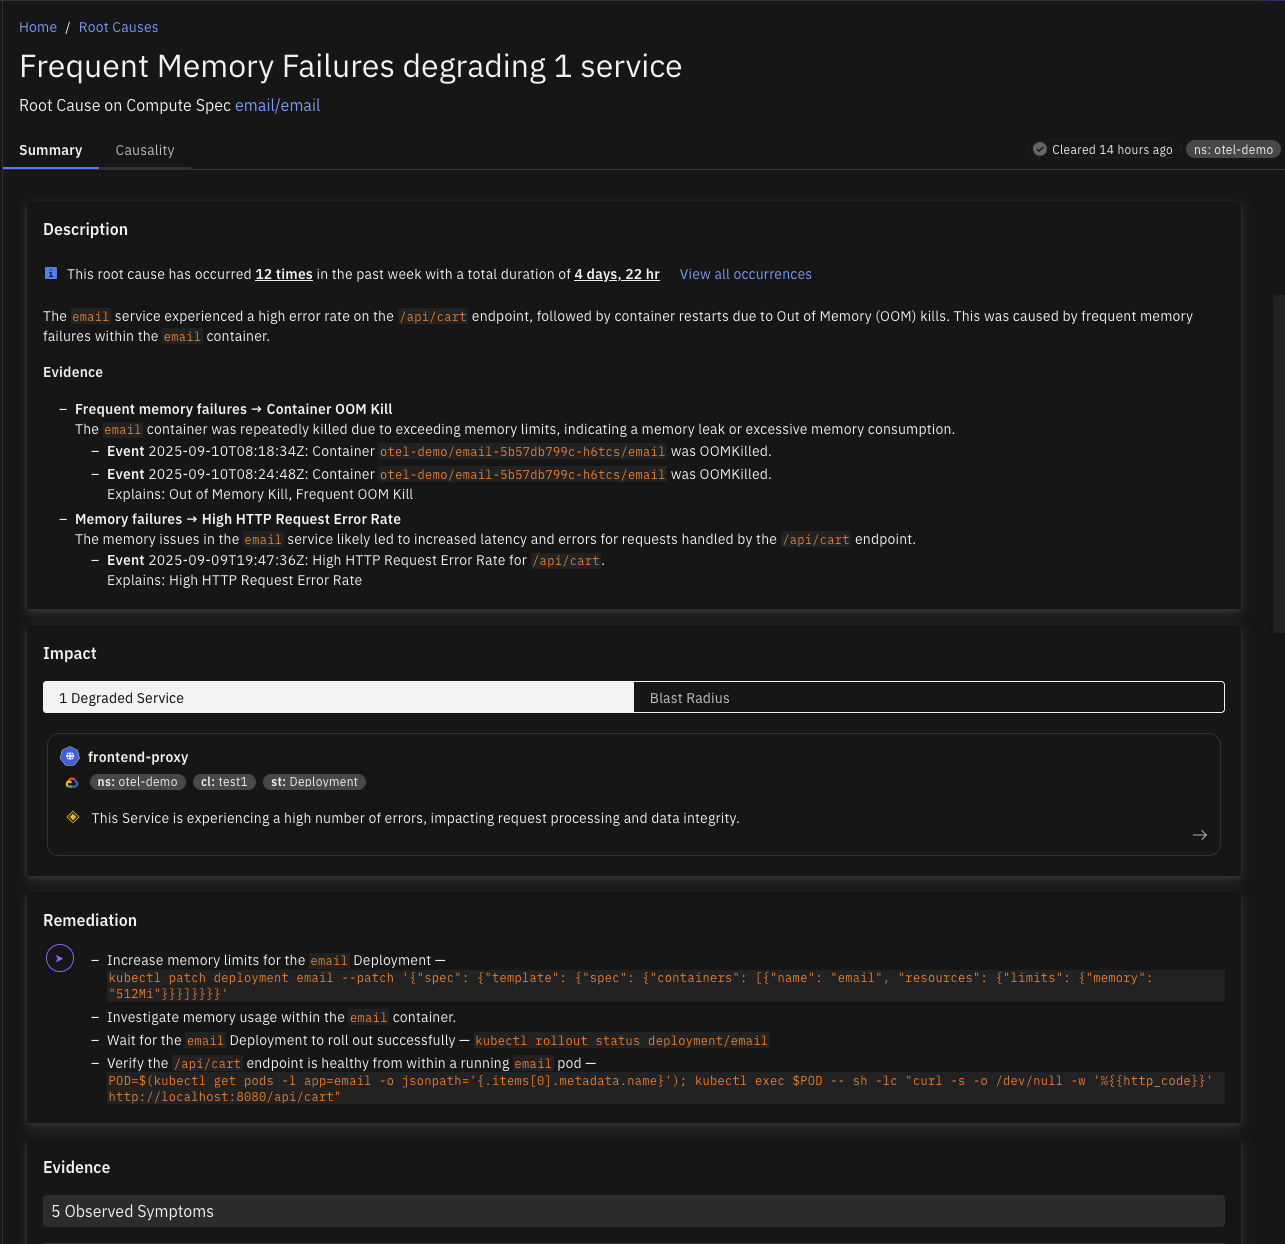
Frequent Memory Failure
The application frequently runs out of memory, leading to crashes, performance degradation, or instability. This affects the application's availability and can lead to downtime or poor user experience. The issue is likely due to inefficient memory usage, such as memory leaks, excessive data loading into memory, or improper garbage collection.
Memory Failure
Containers running out of memory can lead to service crashes or degraded performance, resulting in errors for end users or failed service requests. This typically occurs when a container's allocated memory is insufficient for the workload it is handling, causing out-of-memory (OOM) errors and potential system instability.
Container
Ephemeral Storage Congested
A container is experiencing ephemeral storage congestion when its ephemeral storage usage becomes critically high, leading to failures in operations that depend on temporary storage. This may be triggered by factors such as excessive logging, inadequate cleanup of temporary files, or unexpected bursts in data processing.
Ephemeral Storage Noisy Neighbor
A container acting as a noisy neighbor consumes excessive ephemeral storage, resulting in abnormally high storage usage and contributing to node-level disk pressure that can trigger pod evictions. This issue arises when a container consistently uses more ephemeral storage than expected.
Memory Noisy Neighbor
A container acting as a noisy neighbor consumes excessive memory, leading to abnormally high memory usage and contributing to node-level memory pressure that can trigger pod evictions. This issue occurs when a container consistently uses more memory than expected, which adversely impacts both the container and its hosting node.
Controller
FrequentPodEphemeralStorageEvictions
A Kubernetes workload is experiencing frequent pod evictions due to ephemeral storage exhaustion. This disrupts application availability and performance, as pods are terminated when they exceed their allocated storage limits or when node-level storage is under pressure.
Image Pull Errors
Kubernetes controllers may encounter image pull errors when they cannot download container images from a registry, causing Pods to fail in starting or remain in an ImagePullBackOff state. This disrupts the deployment of applications and can affect service availability.
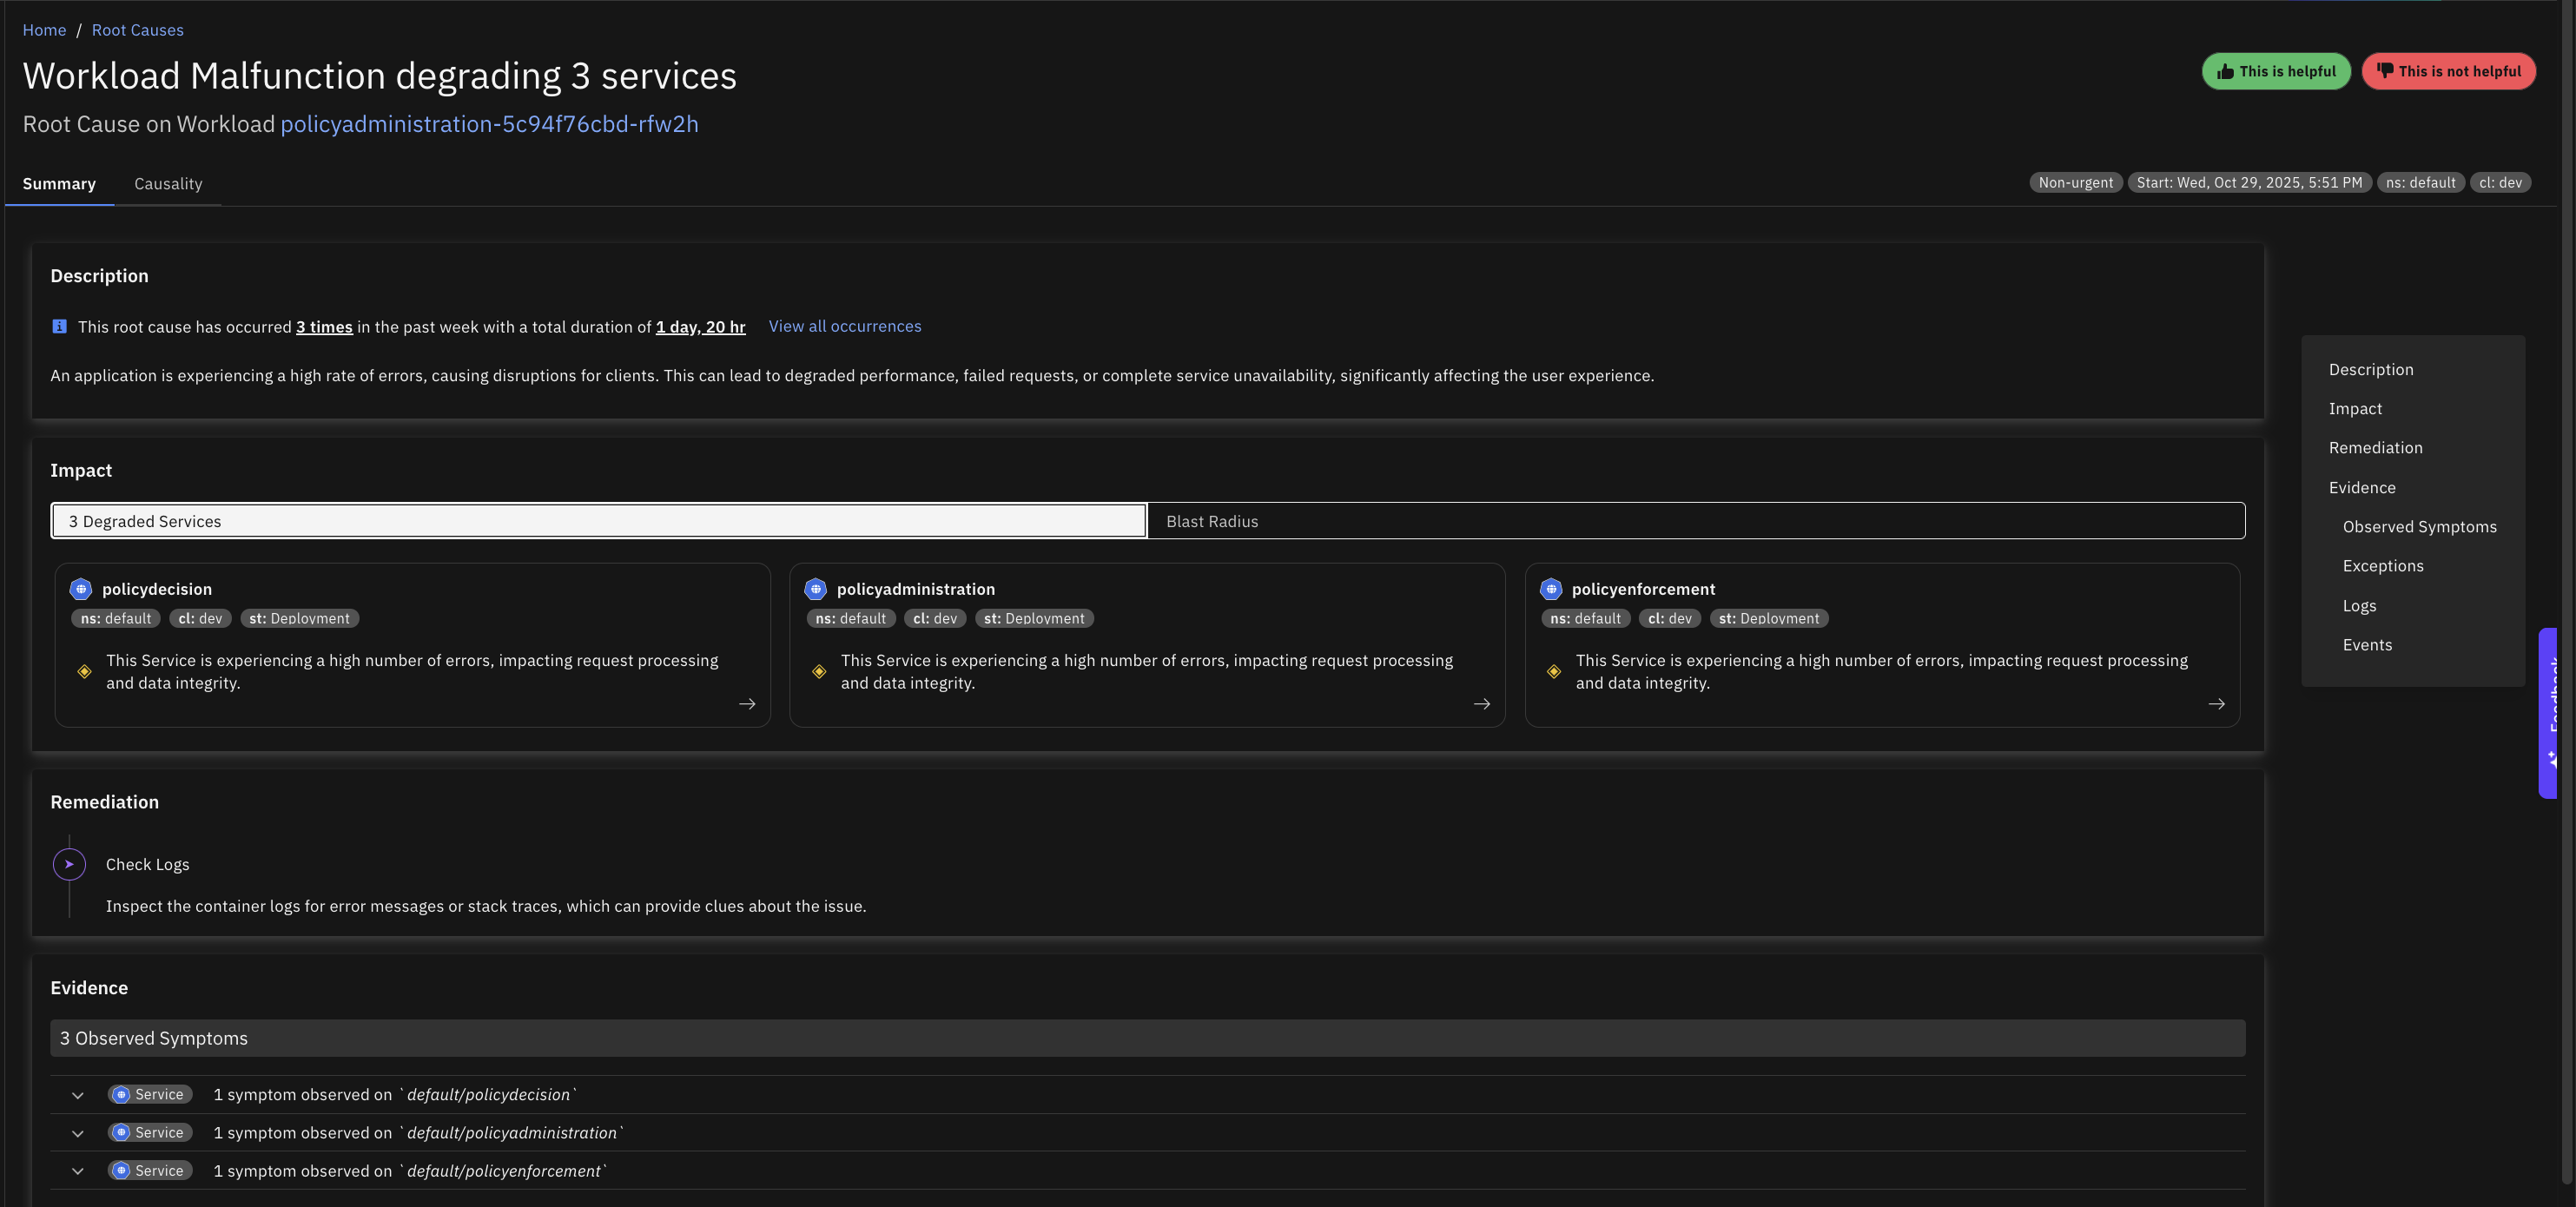
Malfunction
Multiple pods for a Kubernetes controller are in a "NotReady" state for an extended period, which can lead to service unavailability or degraded performance.
Disk
Congested
The disk has reached full capacity, which prevents new data from being written and may cause applications to fail, especially those dependent on free disk space for logs, caching, or temporary files. This can also slow down or halt system operations if critical processes can no longer write to the disk.
Inode Usage Congested
The disk is experiencing inode exhaustion, meaning the file system has run out of inodes (metadata structures for file storage), which prevents new files from being created even if there is free disk space. This often causes errors in applications attempting to create files and can disrupt services reliant on file storage.
IOPs Congested
The disk is experiencing Read/Write Operations Per Second (IOPS) congestion, meaning that the total IOPS capacity is fully utilized. This causes slow performance for applications that rely on disk access, leading to delayed data processing, system lags, or even timeouts.
Read IOPs Congested
The disk is experiencing Read Operations Per Second (IOPS) congestion, meaning that the total IOPS capacity is fully utilized. This causes slow performance for applications that rely on disk access, leading to delayed data processing, system lags, or even timeouts.
Read Throughput Congested
The disk is experiencing congestion specifically in read throughput, which slows down data retrieval from the disk and can degrade the performance of applications reliant on high-speed data access.
Write IOPs Congested
The disk is experiencing Write Operations Per Second (IOPS) congestion, meaning that the total IOPS capacity is fully utilized. This causes slow performance for applications that rely on disk access, leading to delayed data processing, system lags, or even timeouts.
Write Throughput Congested
The disk is experiencing write throughput congestion, leading to slower data write speeds and affecting applications that require high-speed data recording. This issue can cause delays in data availability and reduced performance in write-intensive tasks.
Network Endpoint
Invalid Server Certificate
The network endpoint is serving an invalid server certificate, resulting in a high rate of client request errors due to certificate validation failures. This issue propagates further, increasing the overall request error rate across the system.
Node
Causely Agent Down
The Causely agent on a Kubernetes node is unavailable, creating an observability gap for that node. When the agent is down, telemetry and symptom collection from the affected node may be incomplete or missing, reducing Causely's ability to detect and analyze issues originating there. Common causes include the node becoming unreachable or unavailable and taking the agent down with it, the agent container crashing or failing health checks, CPU, memory, or filesystem pressure on the node preventing the agent from running reliably, and configuration or deployment problems such as invalid configuration, rollout failures, or image errors.
Container Runtime Issue
The node's container runtime is unhealthy or unstable, preventing containers from starting or running reliably. Kubernetes depends on the container runtime to manage the full container lifecycle, including creation, startup, shutdown, and health monitoring. When the runtime is impaired, pods may fail to launch, existing workloads can become unstable, and the node may drift into a degraded state. Common causes include repeated crashes or restart loops in the runtime process that interrupt container lifecycle management, invalid runtime configuration preventing the node from managing containers correctly, overlay filesystem corruption or local disk issues breaking container image operations, and CPU, memory, or I/O saturation destabilizing the runtime.
Disk Pressure
Disk pressure on a Kubernetes node indicates that the node's disk usage is high, potentially causing the eviction of pods, reduced performance, and the inability to schedule new pods. This affects application stability and the node's overall functionality. Disk pressure can arise from insufficient disk space, often caused by log accumulation, container images, temporary files, or application data.
Filesystem Issue
The node filesystem is corrupted or has been remounted read-only, preventing normal node and container operation. The kubelet and container runtime depend on writable filesystem access to maintain state, update pod data, and manage container lifecycles, and when that access is lost, workloads on the node may fail entirely. Common causes include host filesystem corruption that breaks kubelet or runtime state management, the kernel remounting the filesystem read-only after detecting storage errors, and underlying disk or cloud volume failures that surface as filesystem instability.
Kernel Issue
The node kernel is stalled or deadlocked, preventing the host from functioning correctly. Kernel-level failures are severe conditions that can block scheduling, container management, networking, and filesystem operations simultaneously, and a kernel deadlock often precedes full node unavailability. Common causes include bugs in the kernel or kernel modules that deadlock critical host operations, storage or networking drivers triggering hangs under load, and extreme resource contention exposing kernel-level instability.
Kubelet Issue
The kubelet on this node is unhealthy or restarting frequently, disrupting pod lifecycle operations and making the node unreliable. The kubelet is the primary Kubernetes agent on each node and is responsible for reporting node status, managing pod readiness, and coordinating with the container runtime. When it becomes unstable, the node may stop reporting status correctly, fail to update readiness conditions, and struggle to manage running pods. Common causes include CPU, memory, or disk pressure destabilizing the kubelet process, invalid kubelet flags or node configuration causing repeated failures, problems with the container runtime, networking stack, or host filesystem cascading into kubelet instability, and kernel or VM-level host issues making the kubelet unreliable.
Malfunction
A Kubernetes node is unavailable or unresponsive, causing workloads scheduled on it to fail. This typically means the kubelet or the underlying host is no longer operating normally, and pods on the affected node may become unavailable, fail health checks, or stop serving traffic entirely. Common causes include CPU, memory, disk, or kernel resource exhaustion destabilizing the node, the kubelet, container runtime, or other host-level services becoming unhealthy or unreachable, cloud instance failures, network isolation, or underlying VM problems making the node unavailable, and excessive pod concentration or invalid node-level configuration causing the node to become unstable.
Memory Pressure
Memory pressure on a Kubernetes node occurs when available memory falls below critical levels, potentially causing the eviction of pods and instability for applications running on the node. This reduces the node's capacity to run workloads, potentially leading to service disruptions if insufficient resources are available across the cluster.
Network Issue
The node network is unavailable or unstable, causing connectivity failures for node services and workloads. Node-level networking problems can disrupt kubelet communication, service routing, pod-to-pod traffic, and access to external systems, and in practice can make the node appear partially or fully unavailable even when the host itself is still running. Common causes include network interface instability such as resets or repeated unregister events interrupting traffic, misconfiguration in the node's CNI or routing stack isolating the node from the cluster, and underlying VM or cloud network failures cutting the node off from the rest of the infrastructure.
PID Pressure
The node is close to exhausting its process ID capacity, limiting its ability to create new processes and causing workload instability. When PID limits are approached, Kubernetes may be unable to start new processes reliably and workloads can become unstable even when CPU and memory remain available. Common causes include applications or system services creating excessive processes or threads, too many workloads concentrated on a single node, and PID limits configured too low for the workload profile running on the node.
VirtualMachine
Conntrack Table Congested
The conntrack table on a VM is congested, causing new network connections to fail. This typically results in connectivity issues for applications, degraded performance, or downtime for services dependent on network communication. The conntrack table is responsible for tracking active network connections and has a fixed size, which can be exhausted under high connection load.
CPU Congested
A Virtual Machine (VM) experiencing CPU congestion can lead to sluggish application performance, delayed response times, or even timeout errors for users and processes. This typically indicates that the VM's CPU is overutilized, potentially due to high resource demands from applications or insufficient CPU allocation.
Disk Read IOPs Congested
The total disk read IOPS for a cloud VM are congested because the VM has reached its maximum allowable IOPS limit. This results in throttling, which can slow application performance and lead to delays or errors in read-heavy workloads.
Disk Read Throughput Congested
The total disk read throughput for a cloud VM is congested because the VM has reached its maximum allowable read bandwidth. This can lead to slower data transfer rates for read-intensive applications, causing delays in processing and reduced system performance.
Disk Total IOPs Congested
The total disk IOPS for a cloud VM are congested because the VM has reached its maximum allowable IOPS limit. This results in throttling, which can slow application performance and lead to delays or errors in read/write-heavy workloads.
Disk Total Throughput Congested
The total disk throughput for a cloud VM is congested because the VM has reached its maximum allowable bandwidth. This can lead to slower data transfer rates for read/write-intensive applications, causing delays in processing and reduced system performance.
Disk Write IOPs Congested
The total disk write IOPS for a cloud VM are congested because the VM has reached its maximum allowable IOPS limit. This results in throttling, which can slow application performance and lead to delays or errors in write-heavy workloads.
Disk Write Throughput Congested
The total disk write throughput for a cloud VM is congested because the VM has reached its maximum allowable write bandwidth. This can lead to slower data transfer rates for write-intensive applications, causing delays in processing and reduced system performance.
Memory Congested
Memory congestion in a Virtual Machine (VM) leads to slow system performance, application crashes, or even VM instability as the system struggles to allocate memory for running processes. This typically results in frequent swapping or out-of-memory (OOM) errors, impacting applications and user operations.
SNAT Ports Congested
The SNAT (Source Network Address Translation) ports on a virtual machine (VM) are congested, leading to outbound network connection failures or degraded performance for services relying on external APIs or resources. This issue primarily impacts VMs that need to establish multiple concurrent connections to the internet or external systems.