PostgreSQL
- Infrastructure Entities - Complete infrastructure topology including compute, storage, and networking resources
- Metrics - Performance metrics from applications and infrastructure
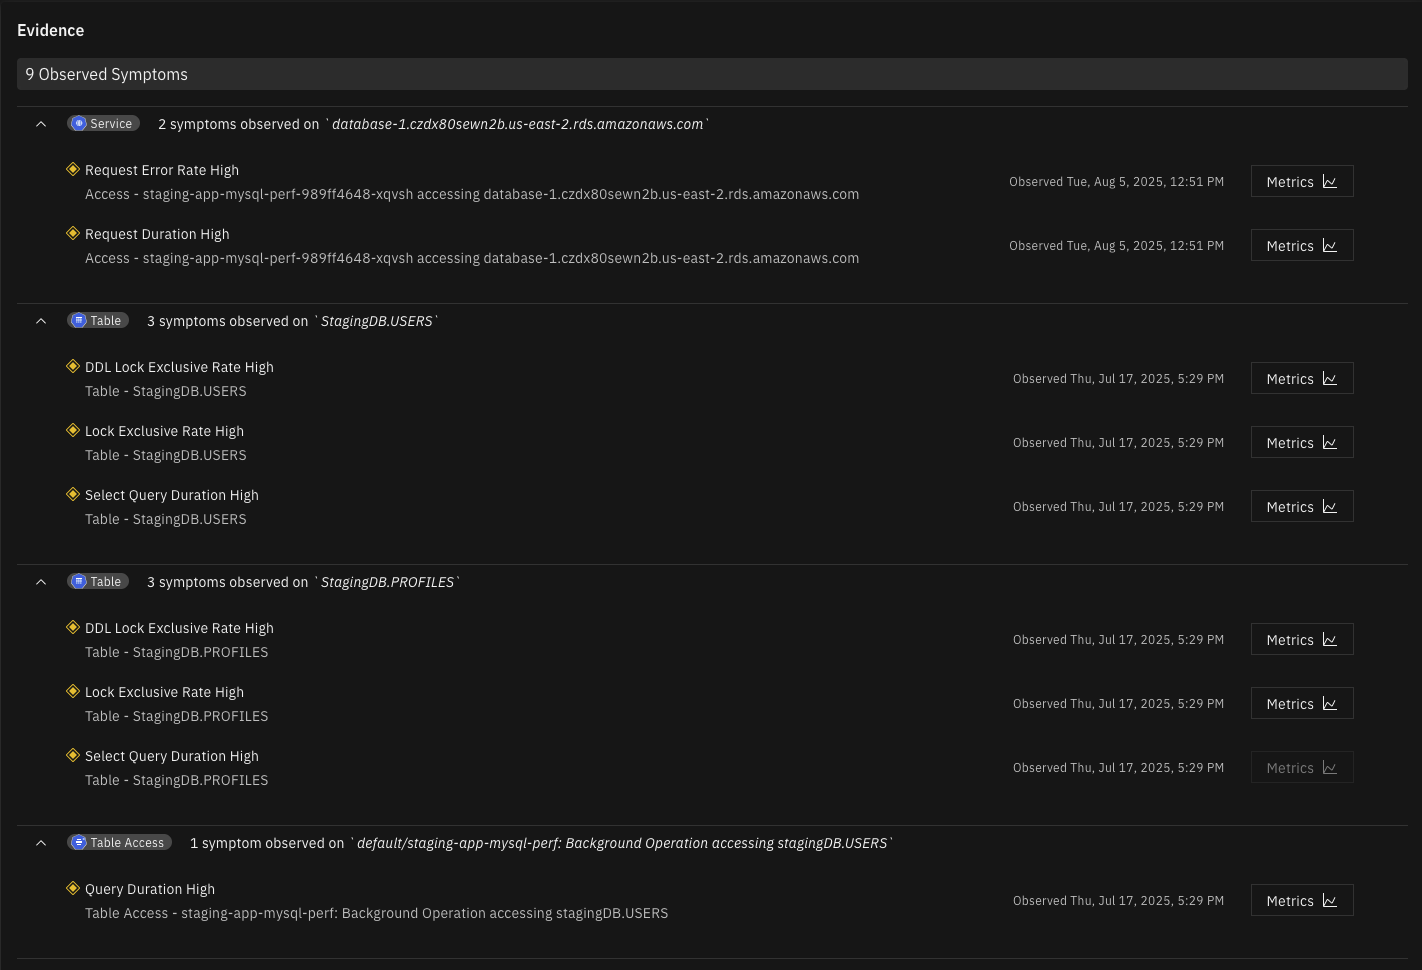
- Symptoms - Automatic symptom detection from metrics, traces, and external monitoring systems
Overview
Causely provides native integration with PostgreSQL to help you identify and resolve database issues before they impact your users.
Instead of just monitoring symptoms, Causely analyzes real-time signals to surface the underlying causal factors driving database issues.
By setting up the PostgreSQL integration, you will be able to do the following:
-
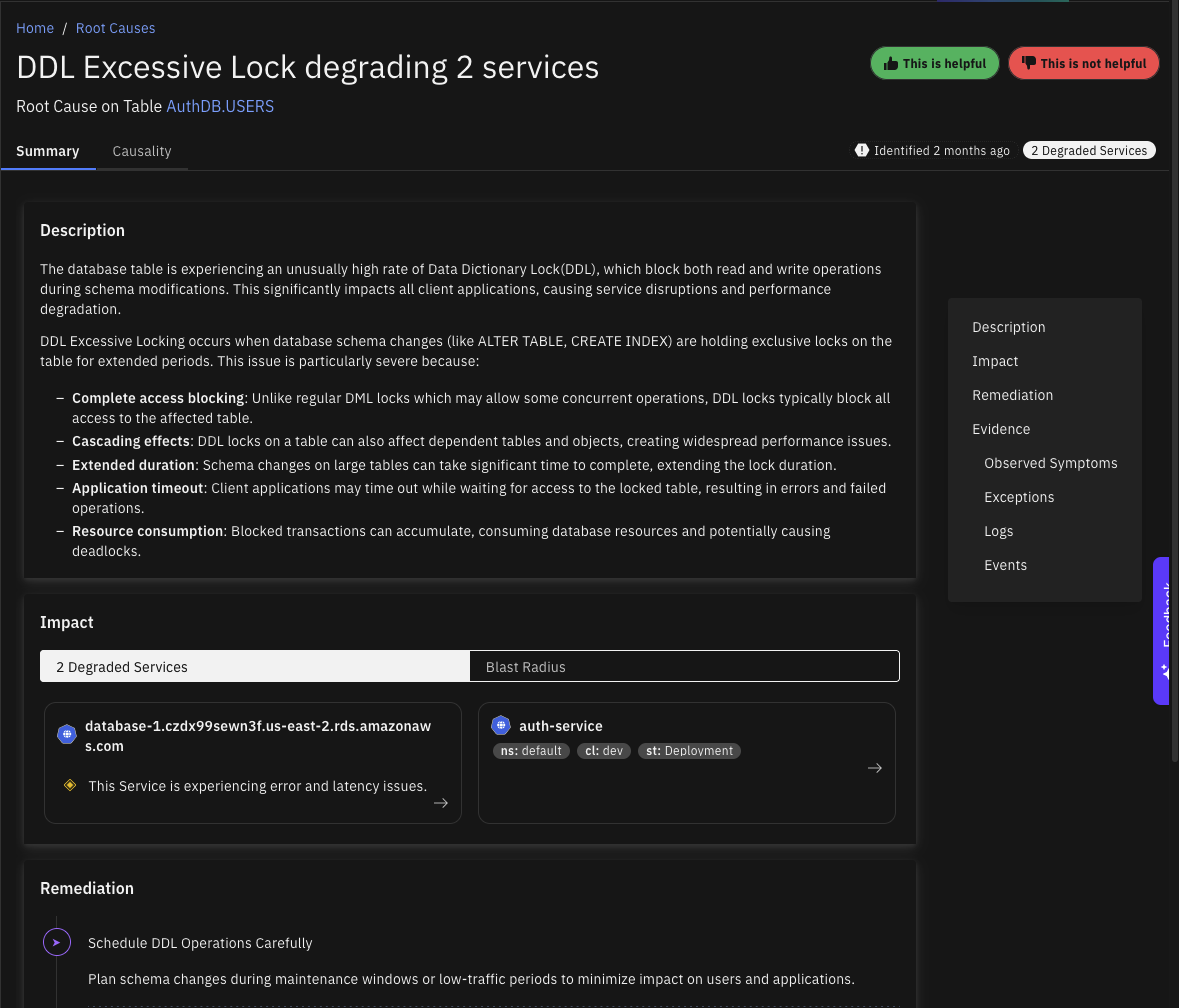
Identify causes for reliability issues originating from your PostgreSQL database, including:
-
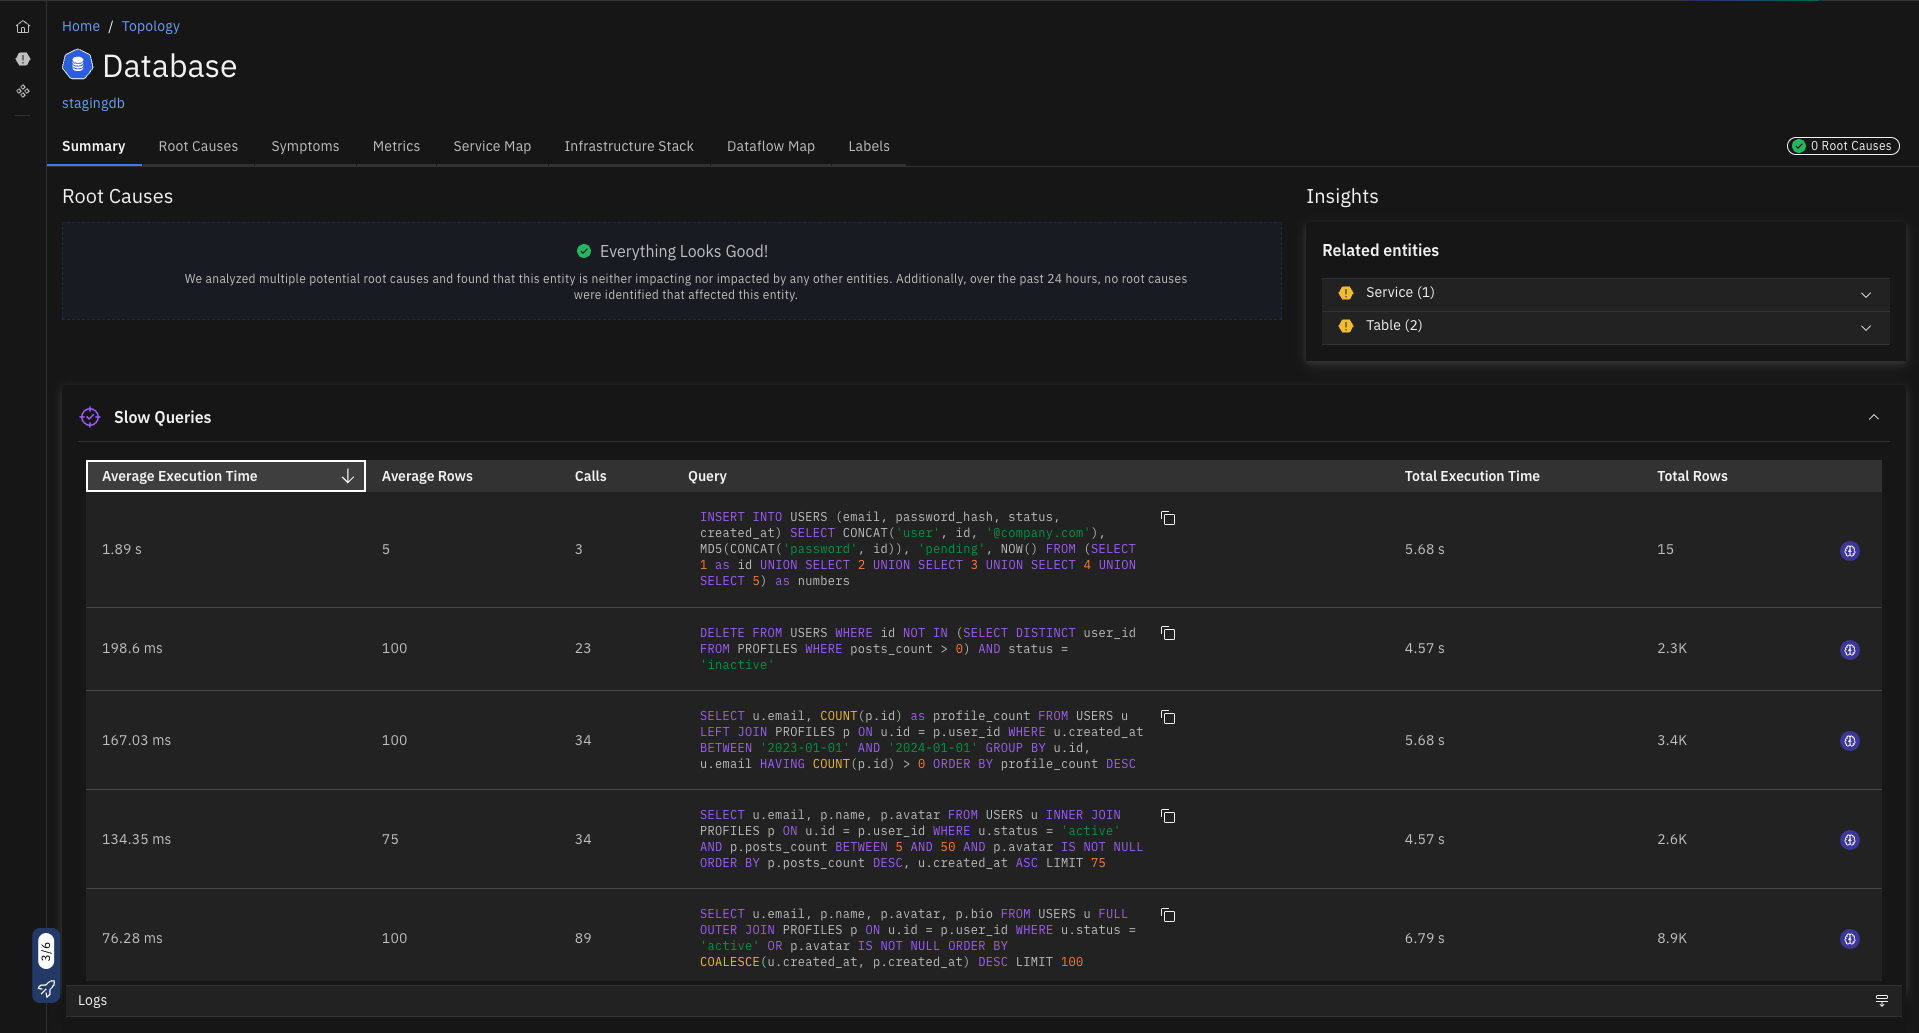
Observe the database as an entity in the Topology Graph, including it's relationships to other entities on the service map, infrastructure stack and dataflow map.
-
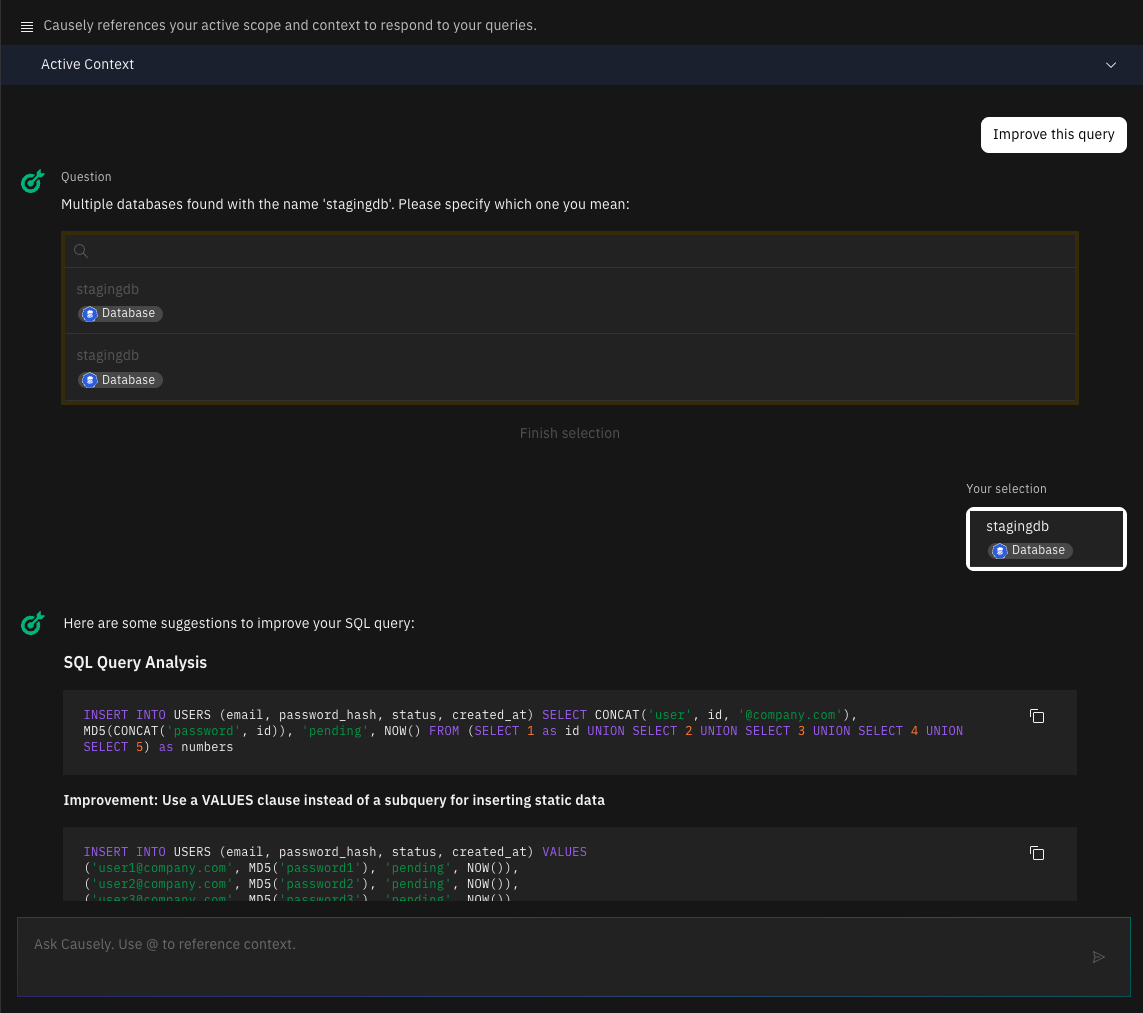
Get insights into the slowest SQL queries, and troubleshoot them with Ask Causely directly from the UI.
The integration supports both self-hosted PostgreSQL instances and cloud-managed services including AWS RDS PostgreSQL, Azure Database for PostgreSQL, and Google Cloud SQL for PostgreSQL.
Setup Guide
Step 1: Create a user
Create a user for your PostgreSQL database server with the following permissions:
pg_read_all_stats: Required to access statistics views and performance datapg_stat_statements: Required to monitor query performance (if using pg_stat_statements extension)SELECT: Required to query performance metrics, table information, and schema detailsUSAGE: Required to access schema information and metadata
Step 2: Enable performance monitoring features
Enable performance monitoring features in your PostgreSQL instance to collect detailed metrics and query information. This step varies depending on your PostgreSQL deployment type, as detailed below.
Native PostgreSQL
For native PostgreSQL installations, you need to enable the pg_stat_statements extension:
- Edit your PostgreSQL configuration file (typically
postgresql.conf) - Add or update these settings:
shared_preload_libraries = 'pg_stat_statements'
pg_stat_statements.track = all
- Restart PostgreSQL
- Connect to your database and run:
CREATE EXTENSION IF NOT EXISTS pg_stat_statements;
AWS RDS PostgreSQL
Steps:
- Go to RDS Console → Parameter Groups
- Edit your parameter group
- Set
shared_preload_librariesto includepg_stat_statements - Restart your instance
- Connect and run:
CREATE EXTENSION IF NOT EXISTS pg_stat_statements;
Azure Database for PostgreSQL
Steps:
- Go to Azure Portal → PostgreSQL server
- Select "Server parameters"
- Set
shared_preload_librariesto includepg_stat_statements - Restart the server
- Connect and run:
CREATE EXTENSION IF NOT EXISTS pg_stat_statements;
Google Cloud SQL for PostgreSQL
Steps:
- Go to Cloud Console → Cloud SQL
- Edit your instance
- Add database flag:
shared_preload_libraries=pg_stat_statements - Restart the instance
- Connect and run:
CREATE EXTENSION IF NOT EXISTS pg_stat_statements;
Step 3: Create a Kubernetes secret for the user
After creating the user create a Kubernetes secret. You have two options:
Option 1: Single Database Configuration
kubectl create secret generic \
  --namespace causely postgres-credentials \
  --from-literal=username="..." \
  --from-literal=password='...' \
  --from-literal=host="..." \
  --from-literal=port=5432 \
  --from-literal=database="..." \
  --from-literal=sslmode="..."
Option 2: Multiple Databases Configuration
For monitoring multiple databases within the same PostgreSQL instance, you can specify multiple databases using the databases field:
kubectl create secret generic \
  --namespace causely postgres-credentials-multidb \
  --from-literal=username="..." \
  --from-literal=password='...' \
  --from-literal=host="..." \
  --from-literal=port=5432 \
  --from-literal=databases="database1,database2,database3" \
  --from-literal=sslmode="..."
Alternatively, you can create the secret using a YAML manifest:
apiVersion: v1
kind: Secret
metadata:
  name: postgres-credentials-multidb
  namespace: causely
type: Opaque
stringData:
  username: '...'
  password: '...'
  host: '...'
  port: '5432'
  databases: 'database1,database2,database3'
  sslmode: '...'
Note: Use either the database field for single database configuration or the databases field for multiple databases. Do not use both fields in the same secret.
Option 3: Database auto-discovery
Causely can discover all databases on a PostgreSQL server automatically with the same credentials. Add auto_discovery: "true" to the secret (for example in stringData).
The host must be the FQDN of your DB, or IP address if there's no DNS entry set up.
It must match the FQDN/IP Causely would discover either from the K8s Server (if it's running in your K8s Cluster) or your Cloud providers API.
Examples:
- Kubernetes:
host=my-postgres.namespace.service.cluster.local - AWS:
host=myinstance.rds.amazonaws.com
If you are leveraging a proxy to connect to your database, like it's common on GCP, host must be the FQDN/IP of your proxy and additionally host_overwrite should be the IP/FQDN of the actual database service:
- GCP:
host=localhost(assuming proxy runs on the same host / Pod).host_overwrite=1.2.3.4(the IP of your GCP Cloud SQL instance as shown in the GCP Console)
Step 4: Update Causely Configuration
Once the secret is created, update the Causely configuration to enable scraping for the new database. Below is an example configuration:
scrapers:
  postgresql:
    enabled: true
    instances:
      - secretName: postgres-credentials
        namespace: causely
Alternative: Enable Credentials Autodiscovery
Causely also supports credentials autodiscovery. This feature allows you to add new scraping targets without updating the Causely configuration. Label the Kubernetes secret to enable autodiscovery for the corresponding scraper.
kubectl --namespace causely label secret postgres-credentials "causely.ai/scraper=Postgresql"
Verify Your Configuration
After completing the setup, use these checks to verify your PostgreSQL instance is properly configured for Causely slow query monitoring.
Quick Check Query
Run this single query to check all requirements at once:
SELECT
    CASE WHEN EXISTS (SELECT 1 FROM pg_stat_user_tables LIMIT 1)
         THEN 'PASS' ELSE 'FAIL: Missing pg_read_all_stats' END AS perm_check,
    CASE WHEN EXISTS (SELECT 1 FROM pg_extension WHERE extname = 'pg_stat_statements')
         THEN 'PASS' ELSE 'FAIL: Extension missing' END AS ext_check,
    CASE WHEN EXISTS (SELECT 1 FROM pg_stat_statements LIMIT 1)
         THEN 'PASS' ELSE 'FAIL: Not loaded/accessible' END AS access_check;
Expected result (all checks passing):
 perm_check | ext_check | access_check
------------+-----------+--------------
 PASS       | PASS      | PASS
| Check | What it verifies |
|---|---|
perm_check | User can access performance views (has pg_read_all_stats role) |
ext_check | The pg_stat_statements extension is installed |
access_check | The extension is loaded and queryable |
If any check shows FAIL, follow the detailed checks below to resolve the issue.
Detailed Checks and Fixes
1. Permissions Check
-- Should return a row without error (tests pg_read_all_stats permission)
SELECT 1 FROM pg_stat_user_tables LIMIT 1;

-- Should return a row without error (tests information_schema access)
SELECT 1 FROM information_schema.columns LIMIT 1;
If the query fails, grant the required role to your Causely user:
-- Run as superuser (or rds_superuser on AWS RDS)
GRANT pg_read_all_stats TO <your-causely-user>;
2. Extension Check
-- Should return: t (true)
SELECT EXISTS(SELECT 1 FROM pg_extension WHERE extname = 'pg_stat_statements');

-- Should return a row without error
SELECT 1 FROM pg_stat_statements LIMIT 1;
If the extension is missing, create it:
CREATE EXTENSION IF NOT EXISTS pg_stat_statements;
If the query fails even though the extension exists, the extension is not loaded. You need to configure shared_preload_libraries and restart your instance. See Step 2: Enable performance monitoring features for platform-specific instructions.
3. Shared Preload Libraries Check
-- Should show: pg_stat_statements in the value
SELECT setting FROM pg_settings WHERE name = 'shared_preload_libraries';
If pg_stat_statements is not in the output, you need to add it to your configuration and restart the instance. Refer to the platform-specific instructions in Step 2.
Test Slow Query Access
Run this query to confirm Causely can collect slow query data:
SELECT query, calls, total_exec_time
FROM pg_stat_statements
ORDER BY total_exec_time DESC
LIMIT 5;
This query should return results without error. If the table is empty, that's normal for a freshly configured instance—queries will appear after your application runs.
If the test query works, your PostgreSQL instance is correctly configured for Causely slow query monitoring.
Setup Checklist
Use this checklist to verify all configuration steps are complete:
-
shared_preload_librariesincludespg_stat_statements(requires instance restart) - Extension created:
CREATE EXTENSION IF NOT EXISTS pg_stat_statements; - User has
pg_read_all_statsrole:GRANT pg_read_all_stats TO <user>; - Verification query succeeds:
SELECT 1 FROM pg_stat_statements LIMIT 1;
What Data is Collected
The PostgreSQL scraper collects comprehensive metadata and performance information from your PostgreSQL databases, including:
- Database entities with names and relationships to hosting services
- Service-to-database mappings (which service provides which database)
- Connection details including host, port, and SSL configuration
- Database and table schemas with complete structural information
- Table information including names, row counts, and sizes
- Complete table schemas with column definitions, data types, constraints, and indexes
- Foreign key relationships and table dependencies
- Parent-child table mappings for dependency analysis
- Slow query analysis using PostgreSQL's
pg_stat_statements - Lock monitoring
- Cache and I/O performance
- Table performance metrics