Topology
The Topology view presents the entities that the causal reasoning engine has discovered across your environment—ranging from services and workloads to containers, HTTP paths, background operations, data stores, and more. It provides an interactive way to browse, filter, and drill into any entity to understand its health, relationships, and impact.
For background on how entities are modeled and connected, see How Causely Works.
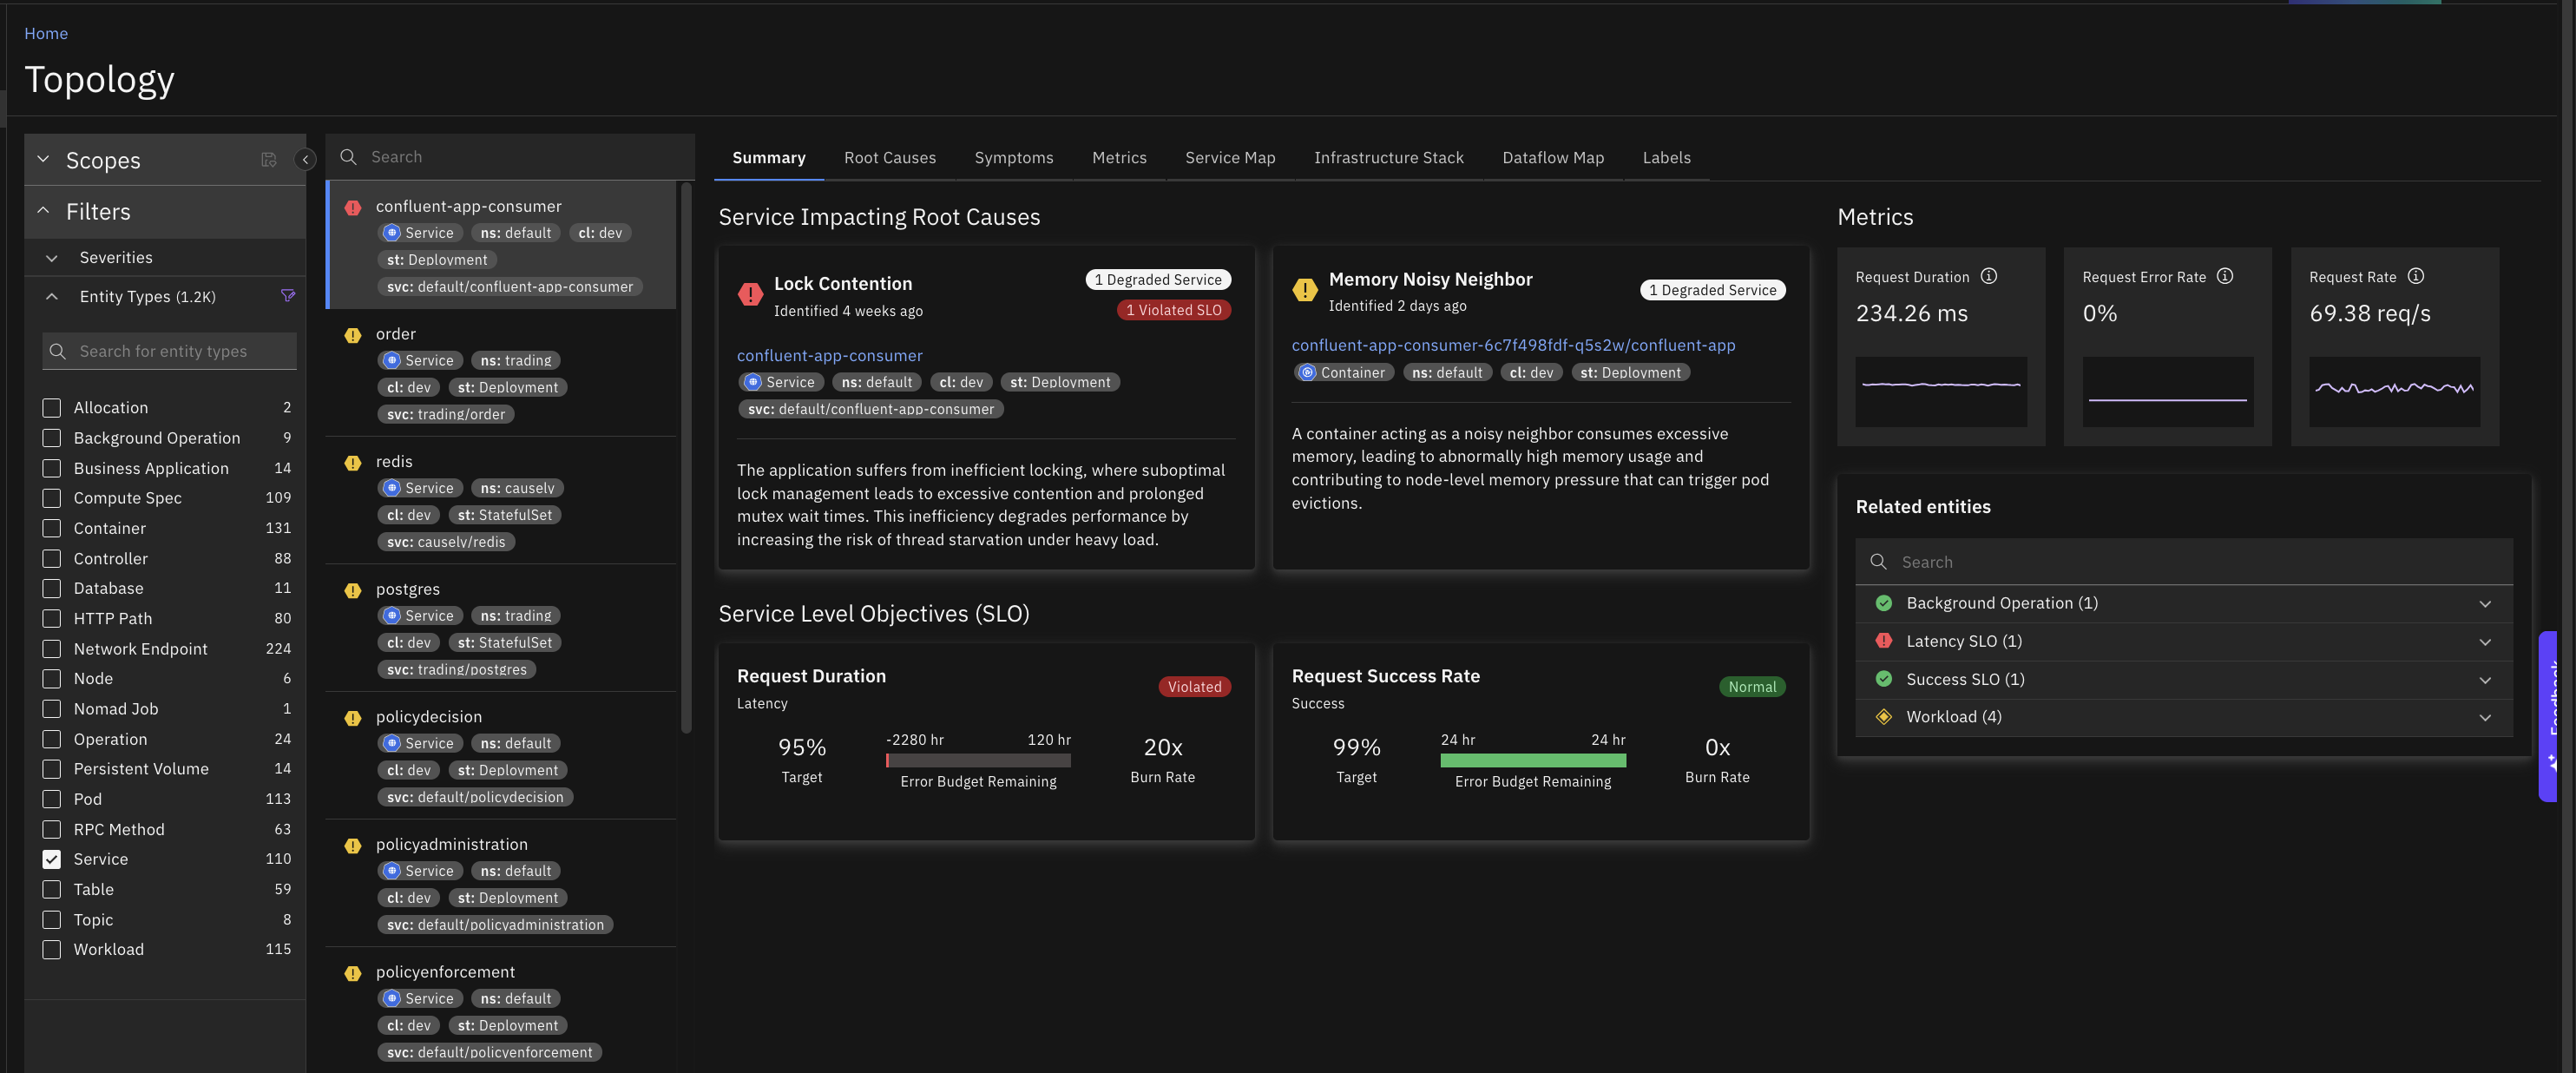
Topology view
The Topology view shows the catalog of detected entities. You can navigate by groupings (for example services or infrastructure), select an entity to open its details, and pivot to related entities as needed.
Filter and search
Use filters and search to focus on what matters most:
- Scope: Limit the visible entities to a specific scope (for example an environment or domain).
- Severity: Show entities with a particular severity state first, helping you triage quickly.
- Type: Narrow the list to a type such as service, container, HTTP path, background operation, data store, or queue.
- Search: Find entities by name, label, or identifier. Search is available across scopes and types when needed.
Inspect a single entity
Opening an entity shows a details panel organized in multiple tabs:
Summary
The Summary tab provides a concise health overview for the selected entity. It highlights SLO status and recent changes, key metrics at a glance, and the most relevant related entities (upstream, downstream, and infrastructure neighbors). Recent logs and events are surfaced inline to provide quick evidence you can drill into.
Root causes
This tab lists causes currently affecting this entity and those that are plausible given observed conditions. Each cause includes a title and severity. Click on a cause to see which symptoms it explains for this entity. This information is available even if the cause is not currently active. This is useful to understand the potential impact of the cause and to validate the impact of the cause when it is active.
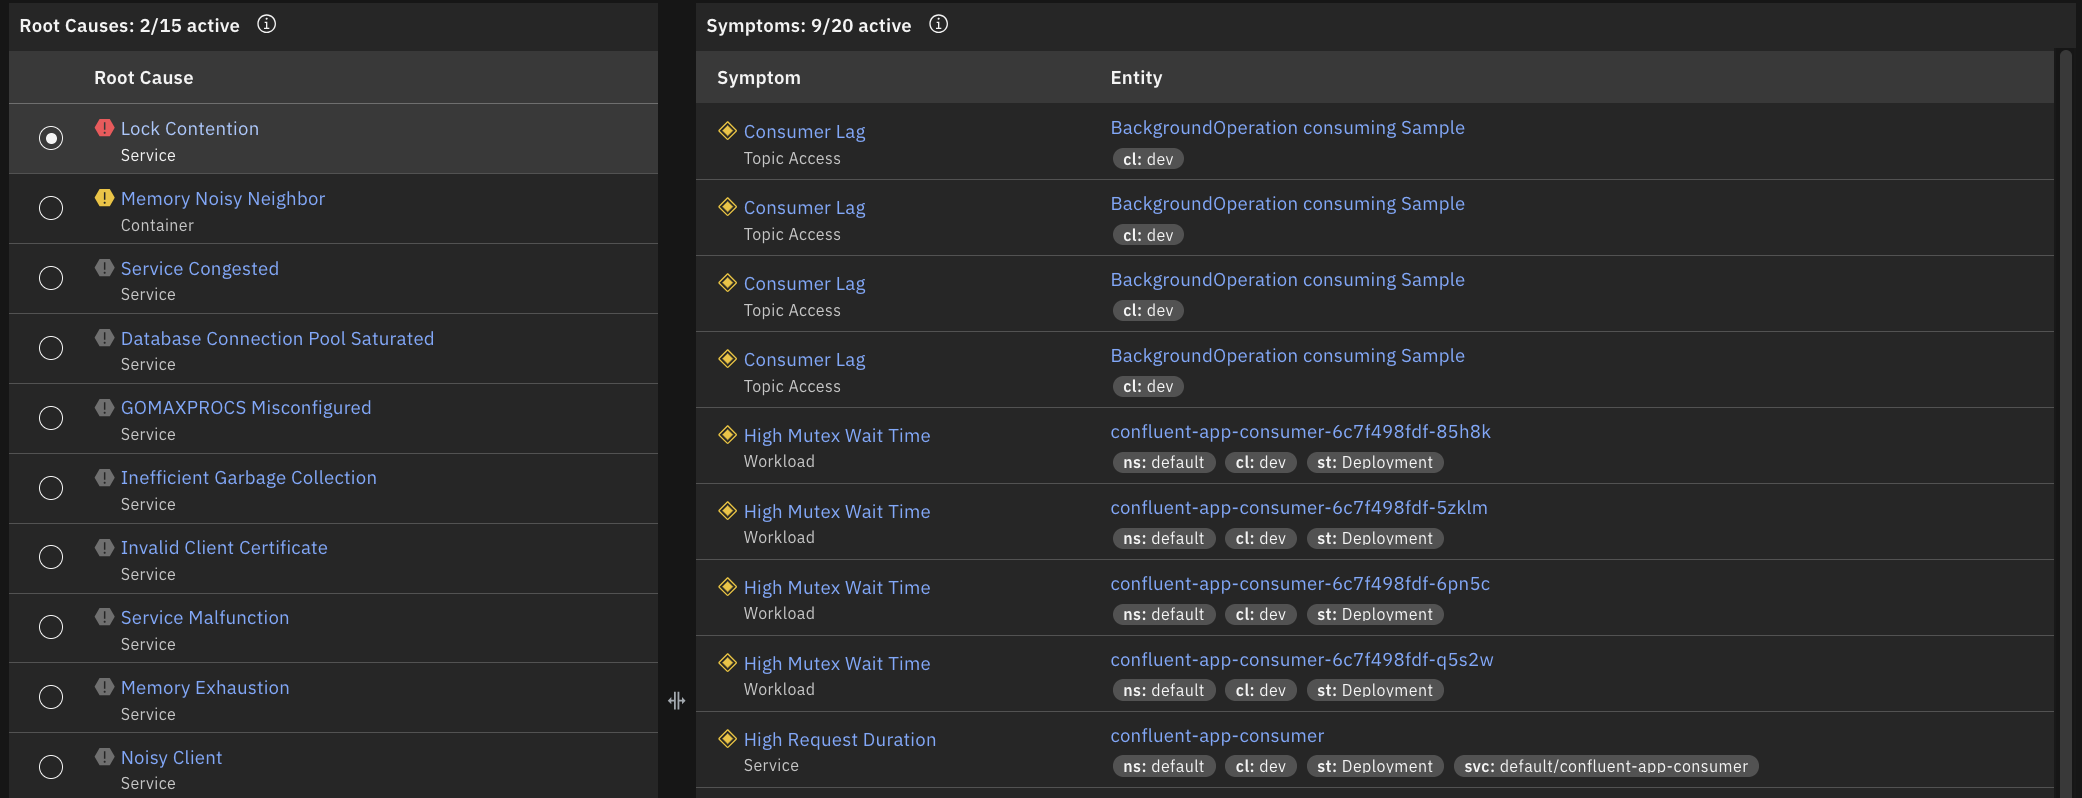
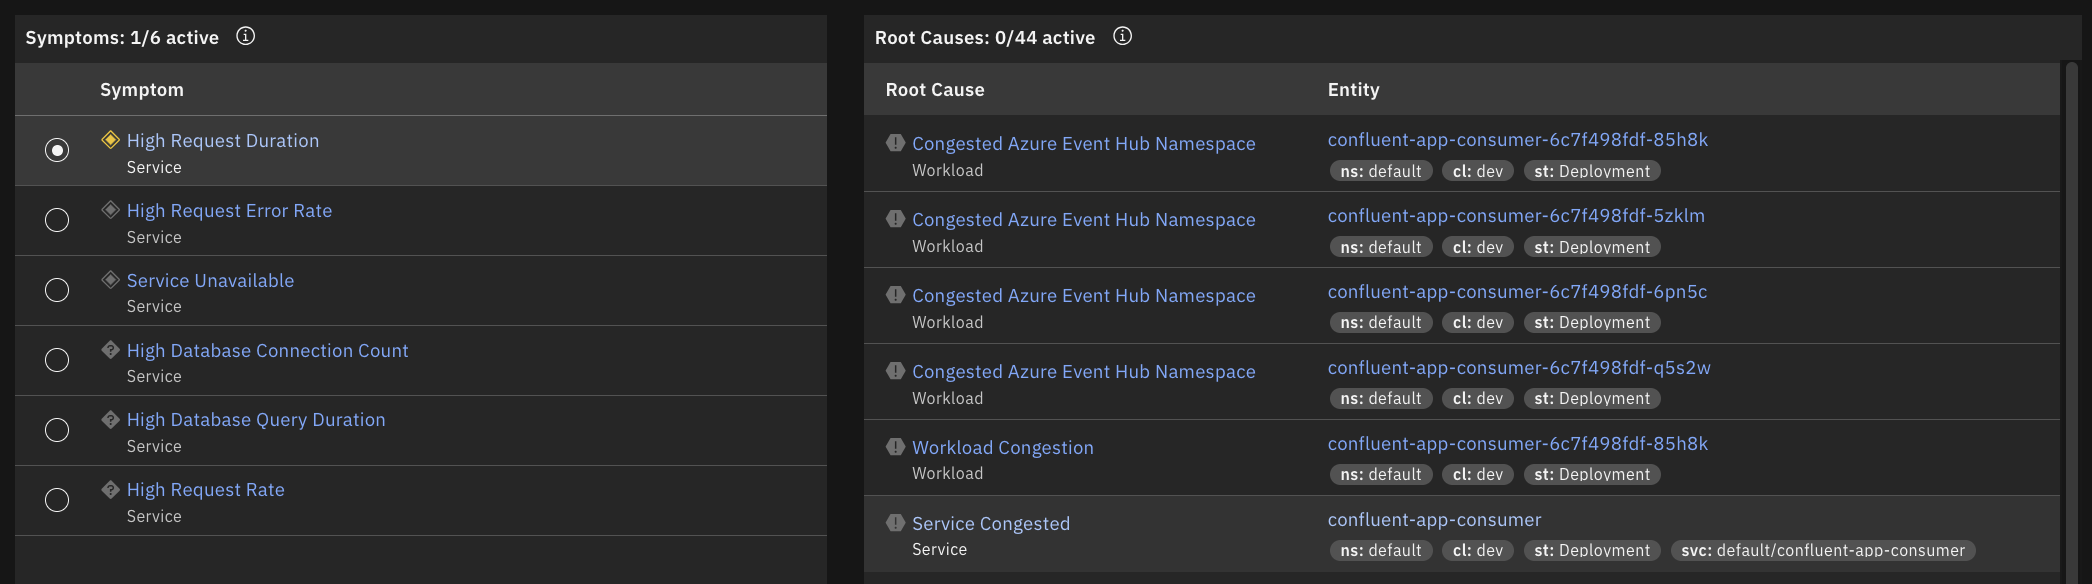
Symptoms
See symptoms detected on the entity or propagated from dependencies. Entries show title and severity. Click on a symptom to see the causes that could lead to this symptom. This information is available even if the symptom is not currently active. This is useful to understand the potential impact of the symptom and to validate the impact of the symptom when it is active.
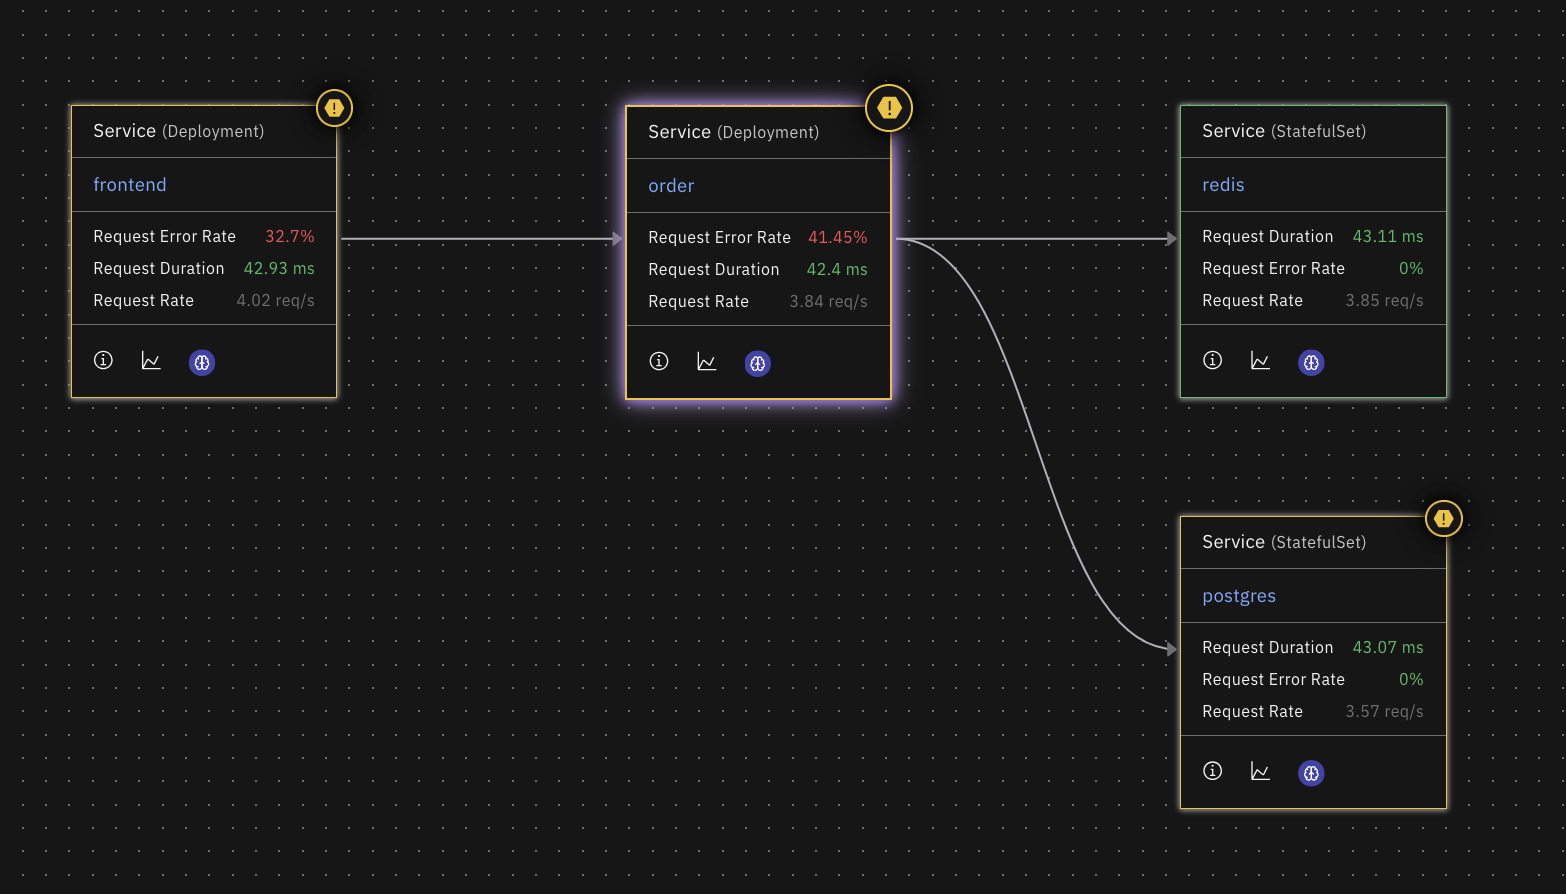
Service map
Visualizes the entity’s service neighborhood, including inbound dependencies and downstream consumers. Edges indicate direction and relative traffic; nodes reflect health at the selected moment.
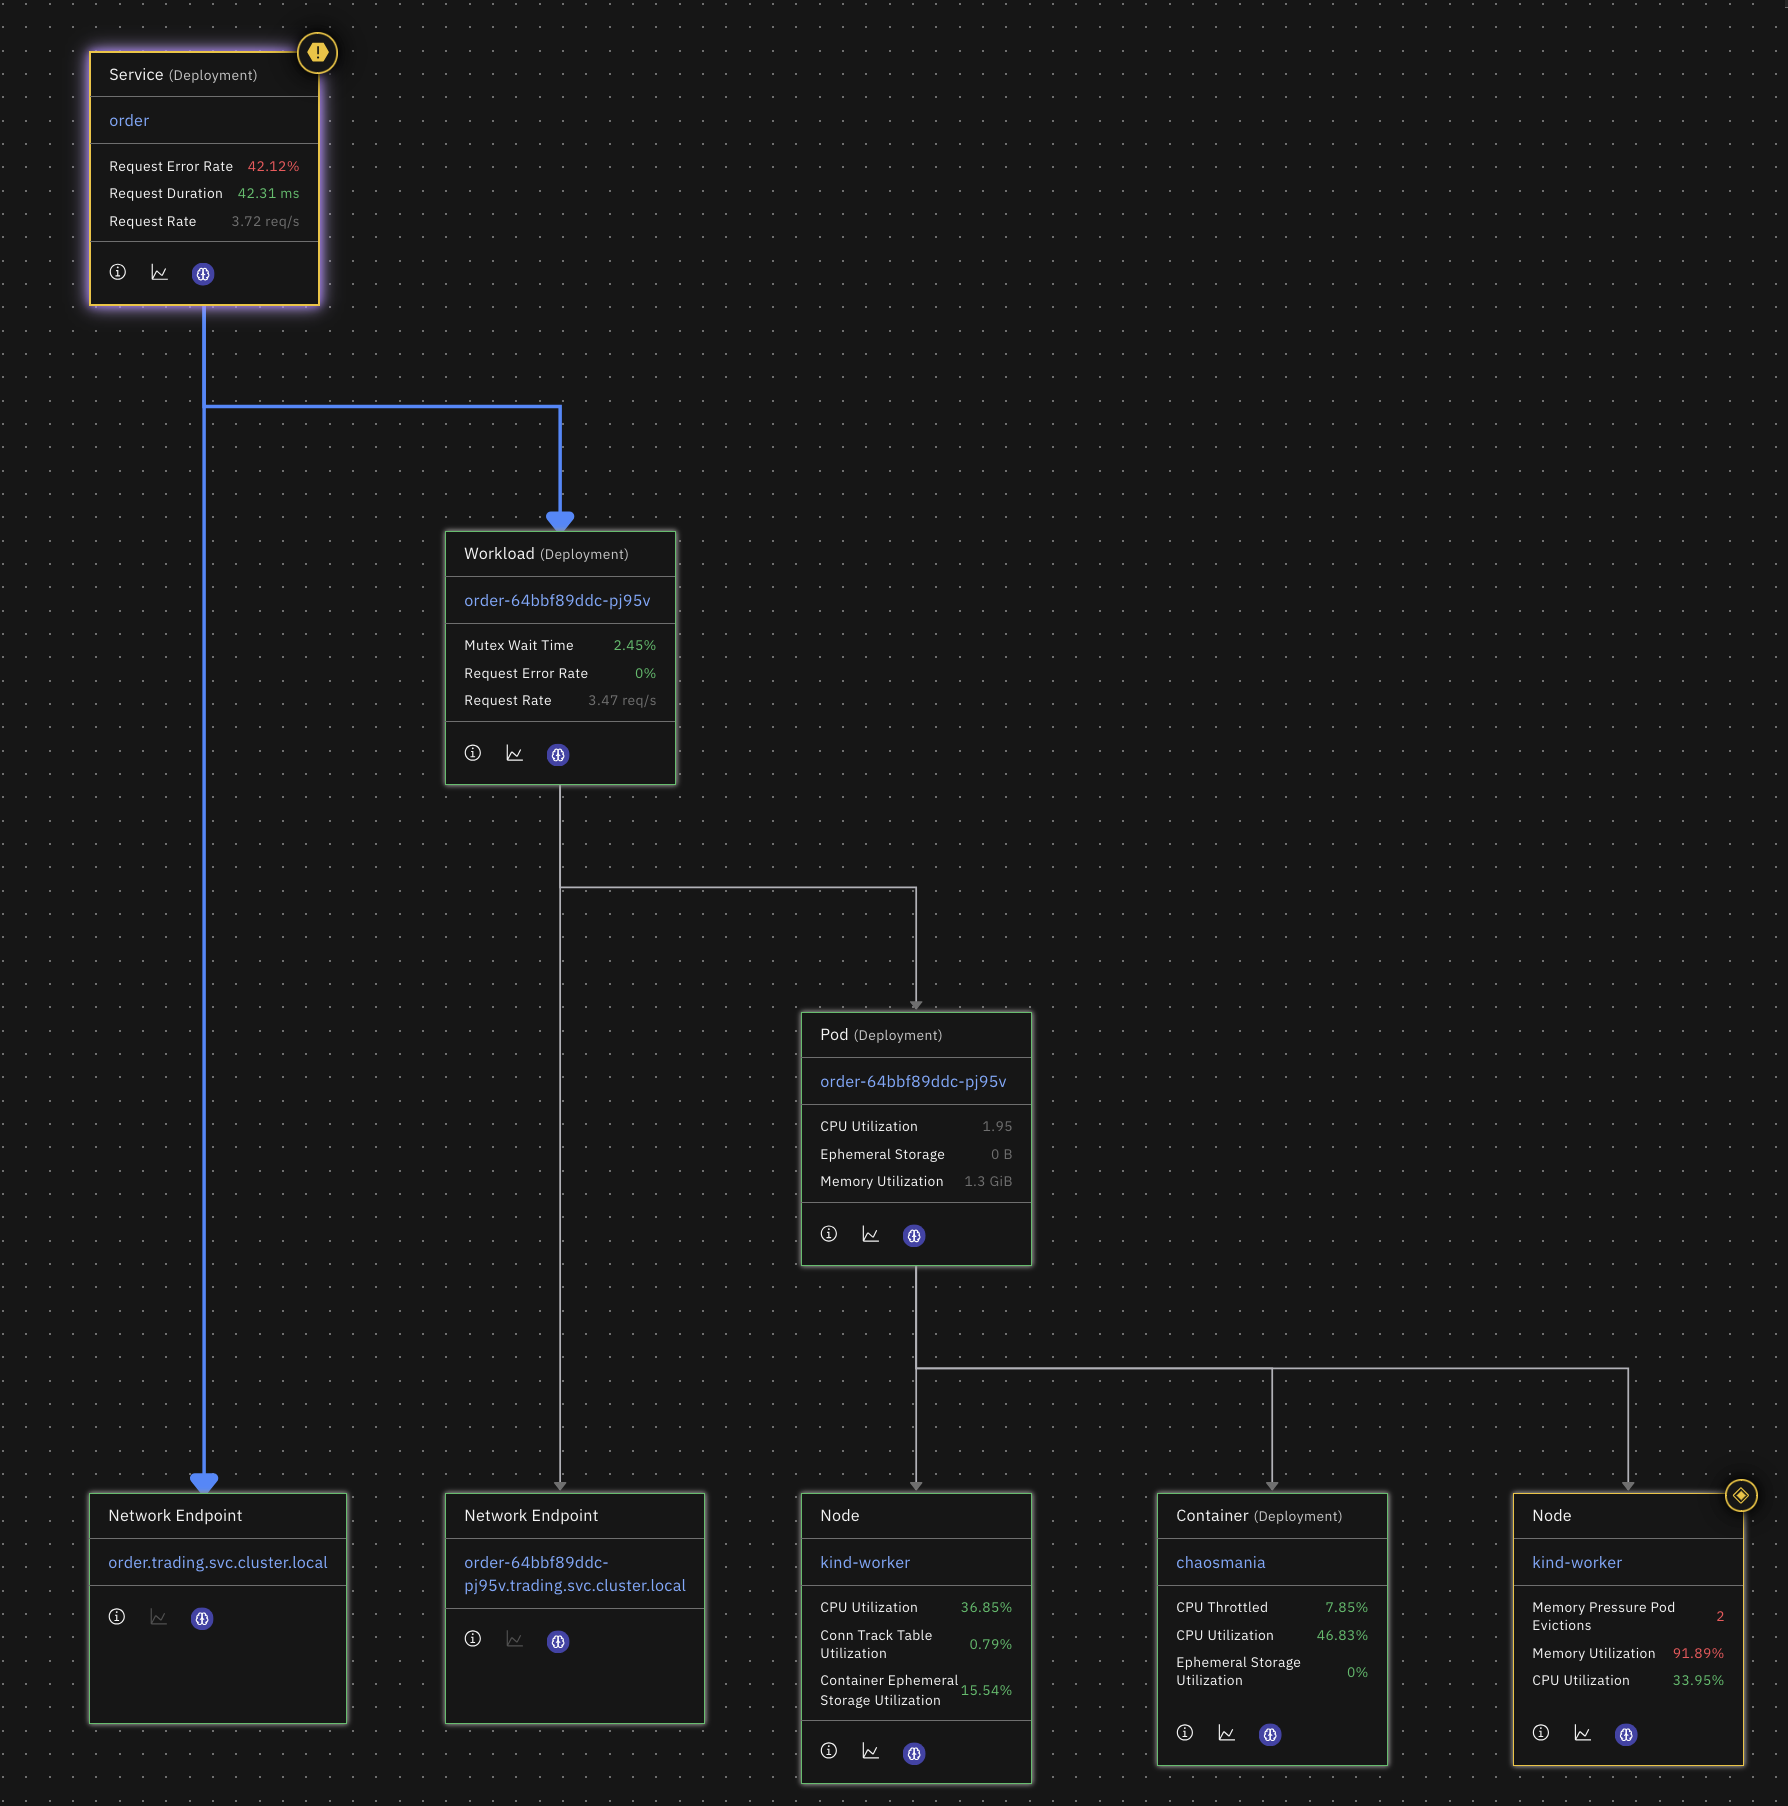
Infrastructure stack
Shows where the entity runs within the stack—for example cluster, node, workload, container, and process. It surfaces capacity and saturation indicators (CPU, memory, disk, and network) and relevant runtime metadata to understand placement and potential resource contention.
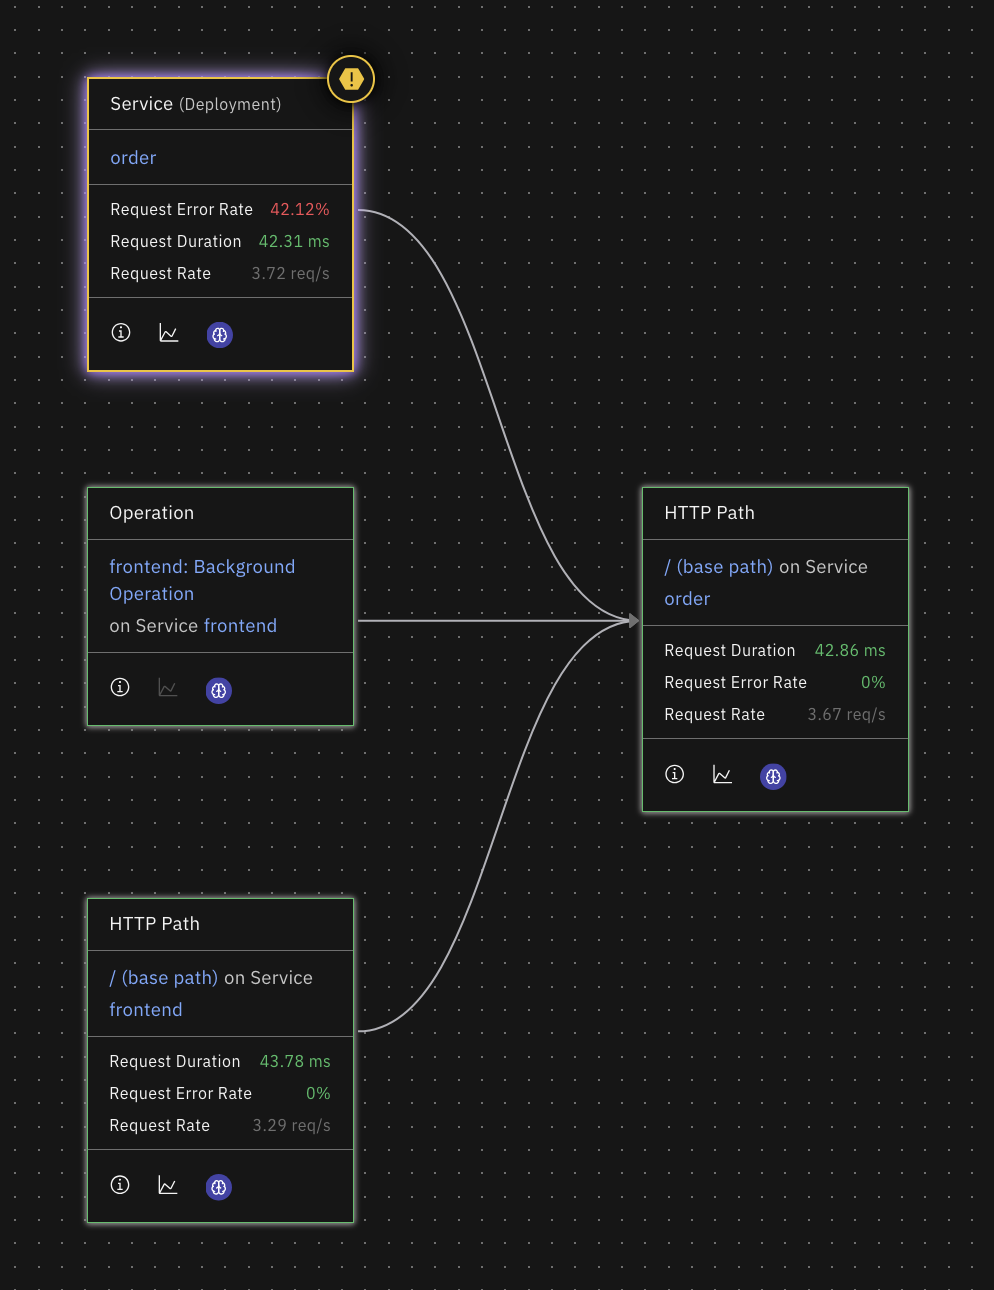
Dataflow map
Displays upstream and downstream data dependencies such as topics, queues, databases, and batch pipelines. Use it to trace how data moves through the system, identify potential bottlenecks or back‑pressure, and assess which consumers are at risk when this entity degrades.
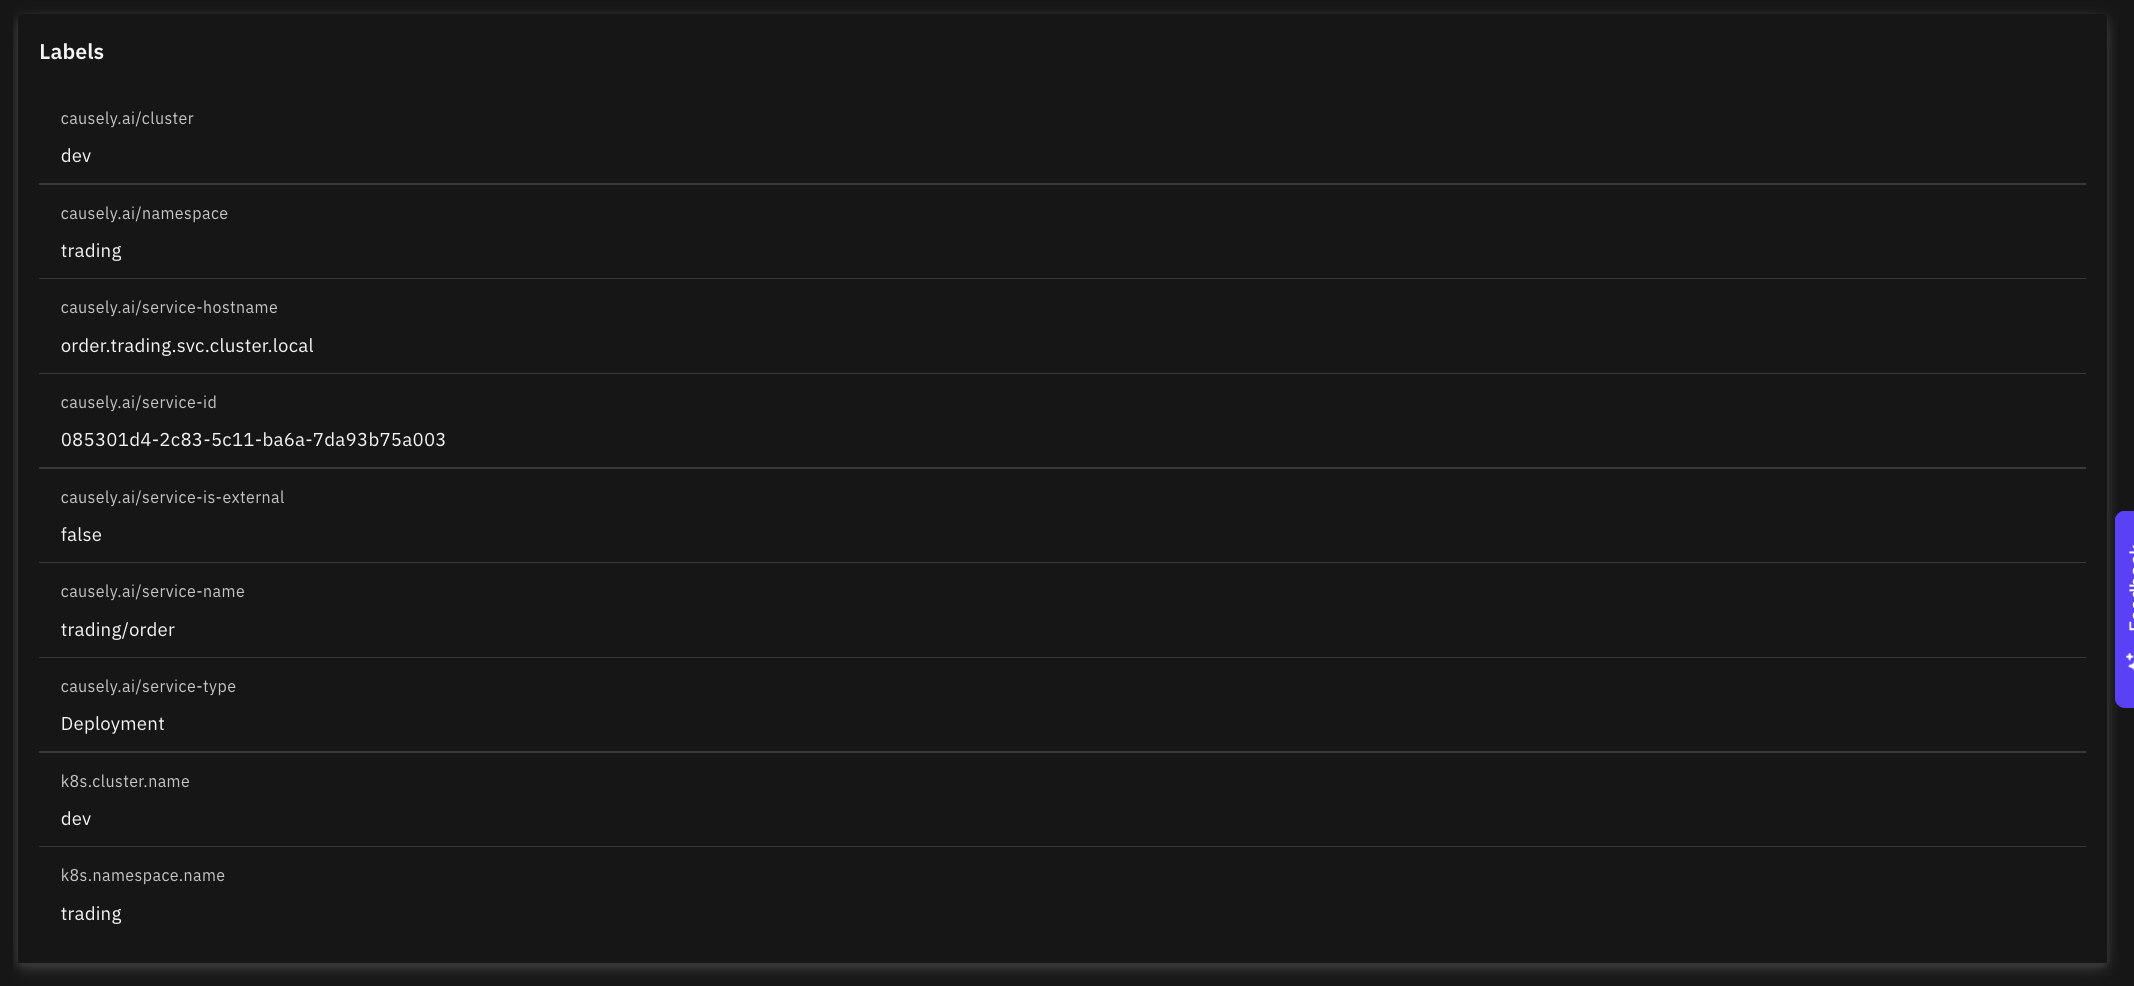
Labels
Lists labels and metadata attached to the entity (team, scope, environment, version, and custom tags). Labels power search and filtering, drive policy and scoping, and help organize entities. You can copy label values and use them to filter the Topology view or jump to related entities.