Issues
The Issues view presents the outcomes of the causal reasoning engine so you see what explains the Signals and problems surfaced in your environment. Instead of receiving an alert per Signal, you get a single Issues and Diagnosis that represents the underlying cause, dramatically reducing noise and accelerating response.
For background on how Diagnoses are inferred, see How Causely Works.
Issues view
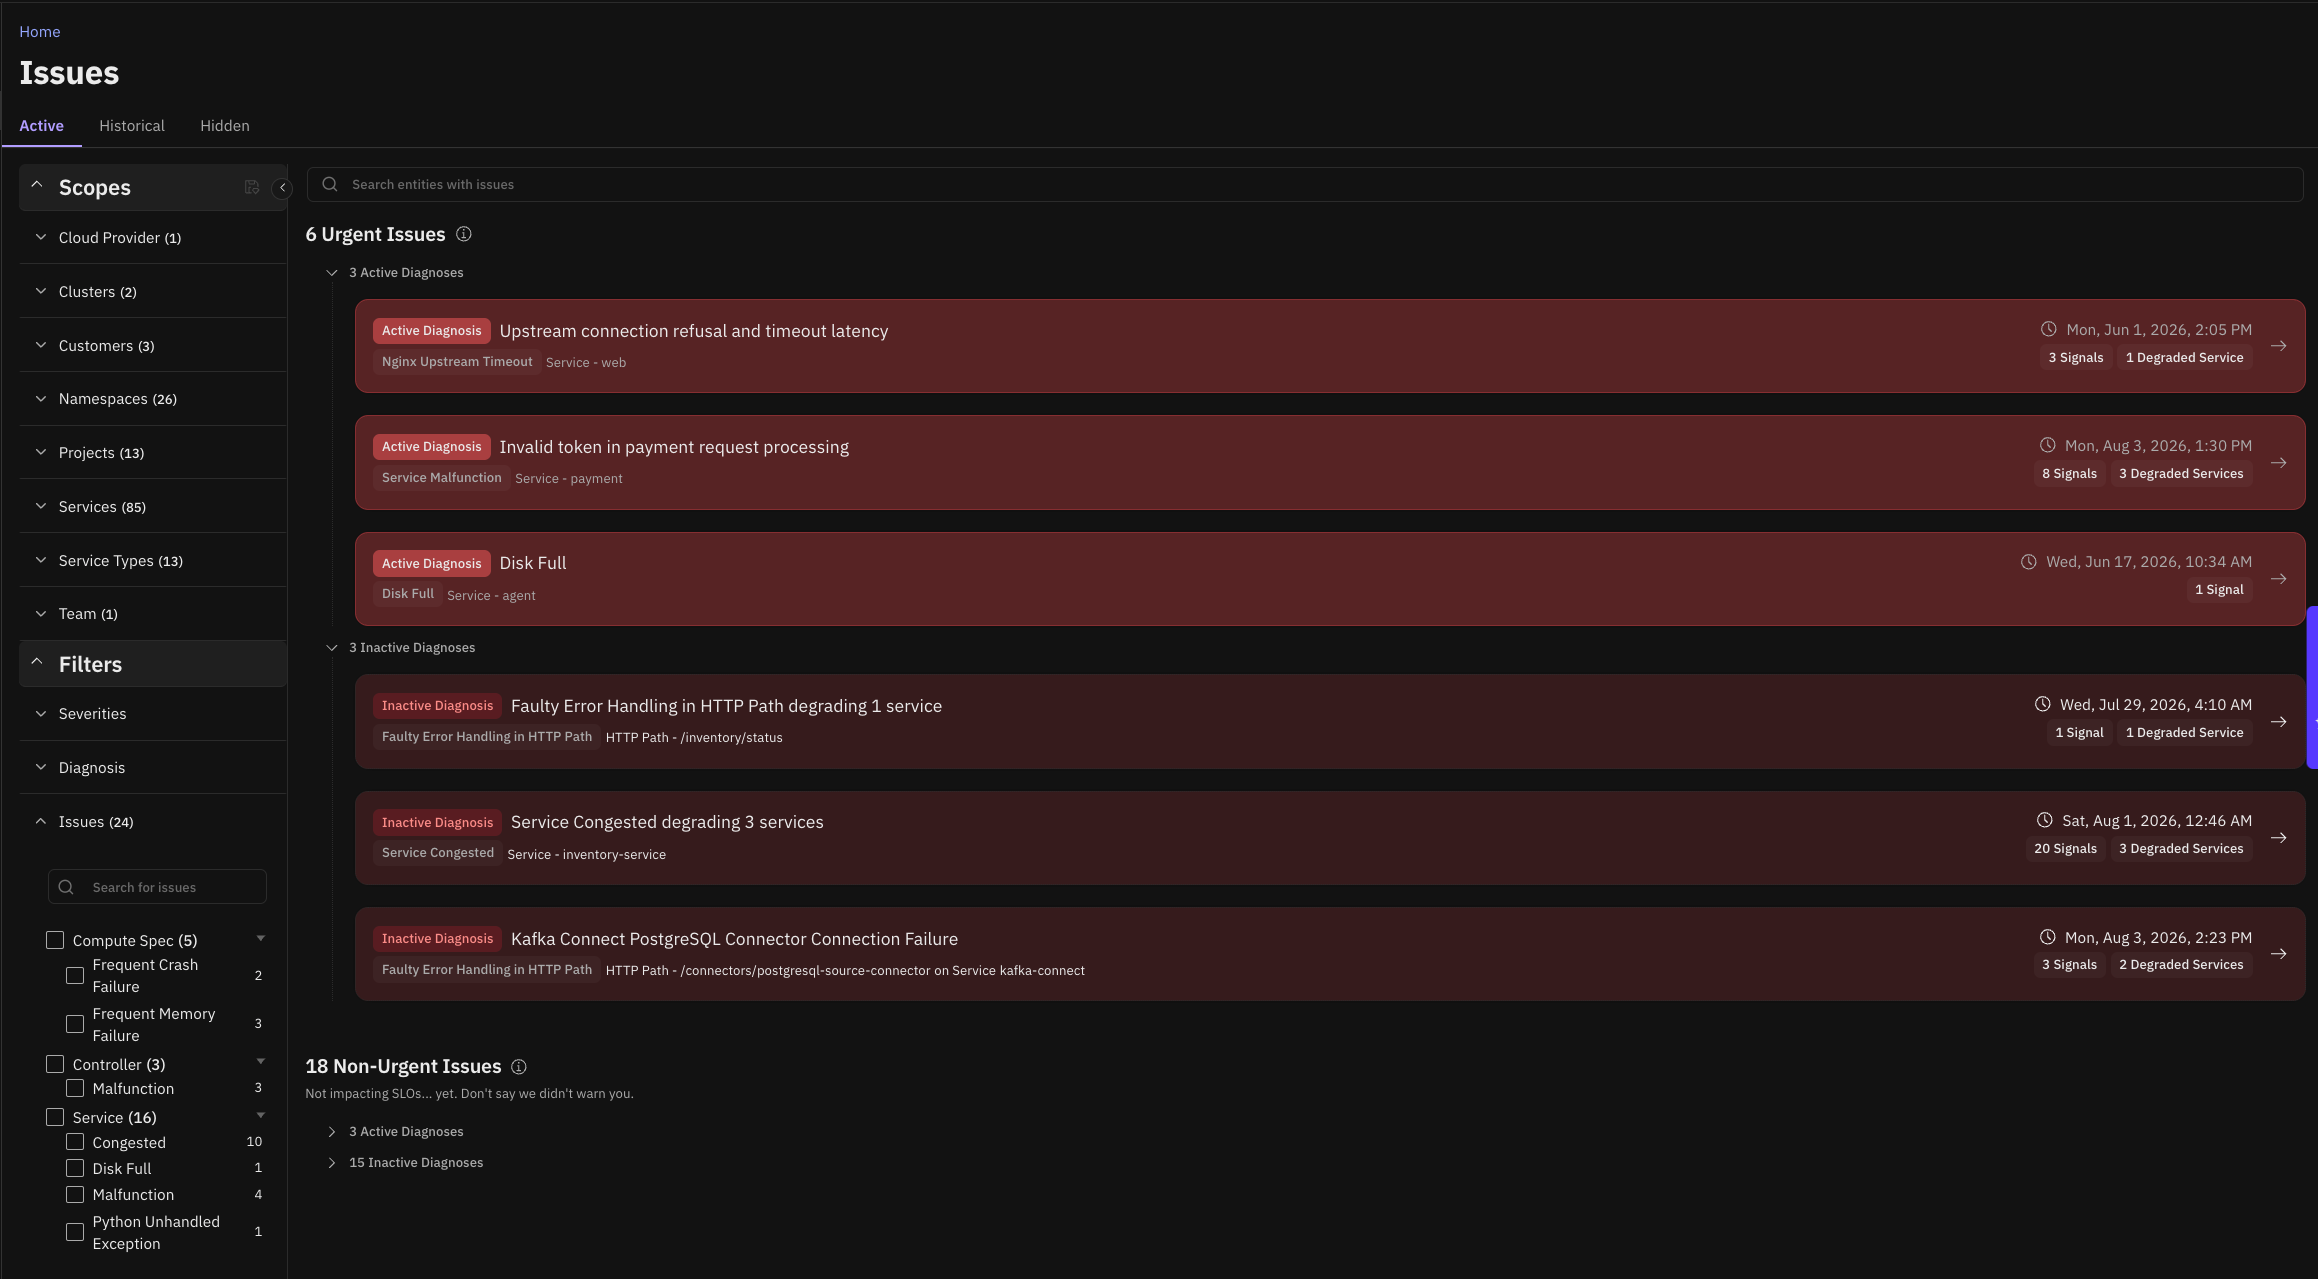
The Issues view shows the list of Issues and inferred Diagnoses, that explain the Signals observed in your environment. The list is filtered by urgency and state, and can be further filtered by scope, service, and workload.
Urgency
Urgent Issues are the ones that are currently impacting services and SLOs. They are marked red. Non-urgent Issues are the ones that are not currently impacting services and SLOs but indicate elevated risk.
Both types are valuable: urgent items drive incident response; non‑urgent items drive prevention and continuous improvement.
States
- Active: The Issue's Signals are currently present, or cleared within the last 24 hours.
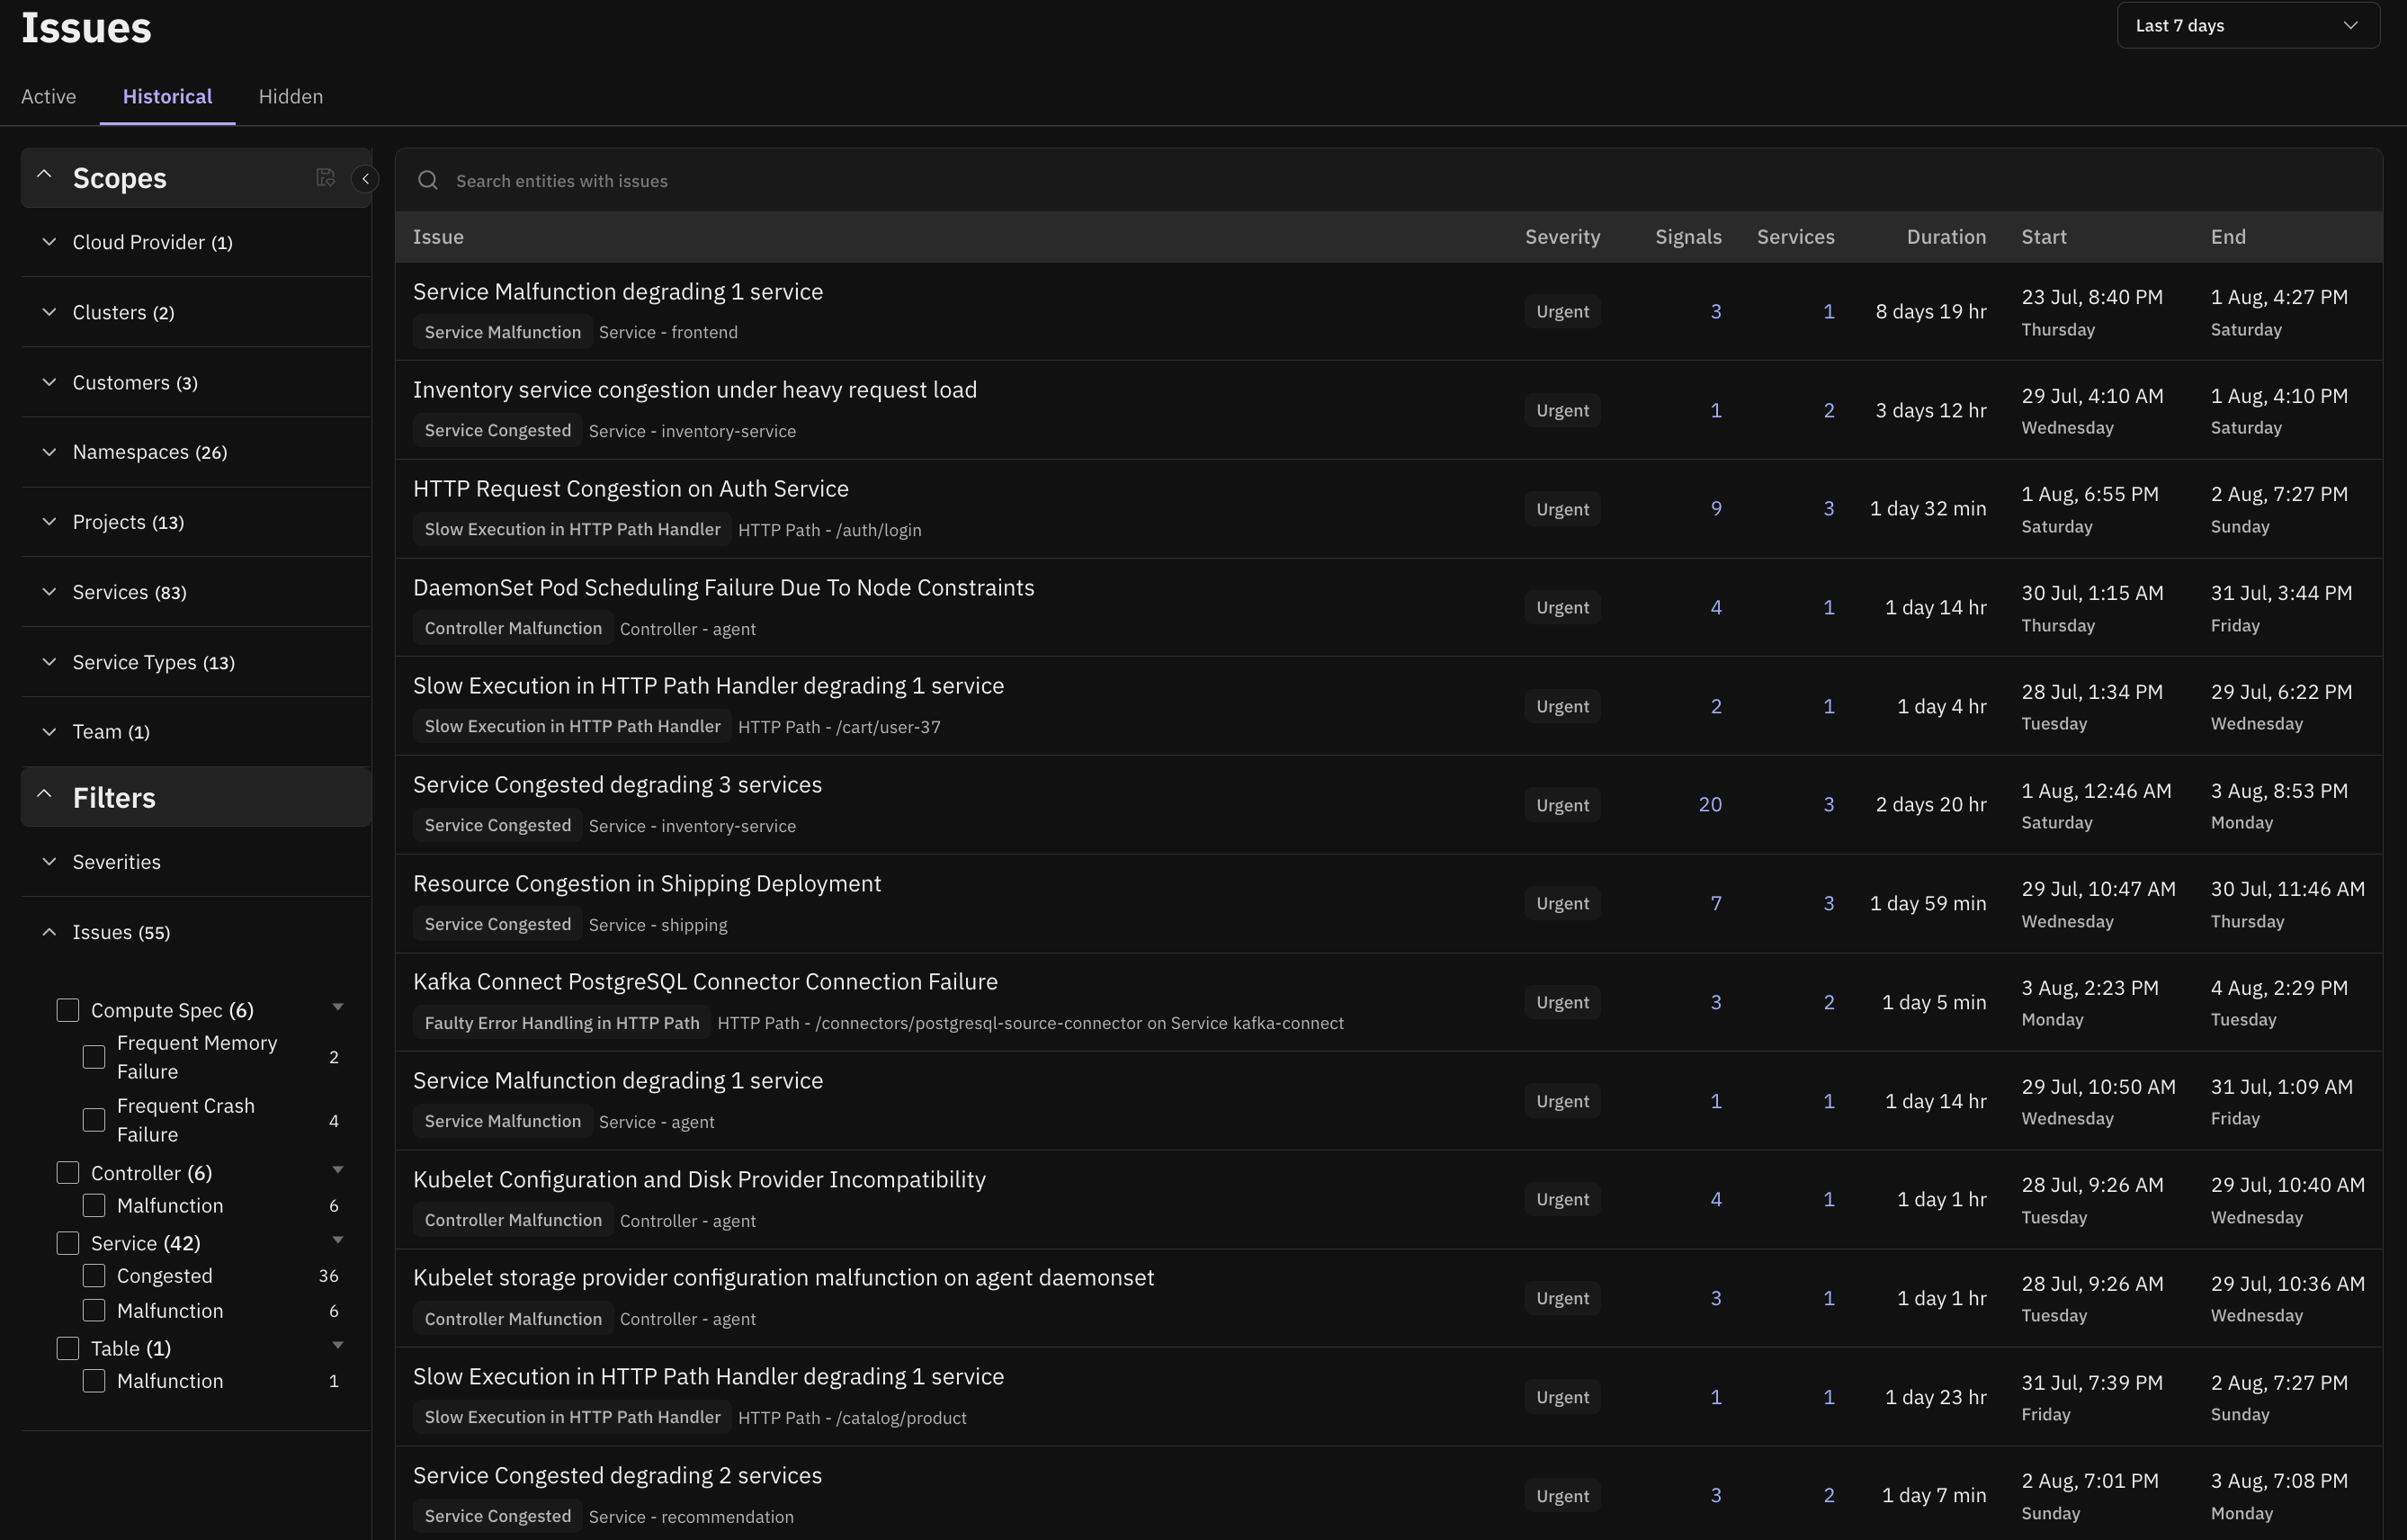
- Historical: The Issue was active in the past and has since cleared. Useful for learning and trend analysis.
- Hidden: The Issue exists but is suppressed from the default list (for example via filters or muted scopes). You can reveal hidden items when needed.
A Diagnosis for the underlying problem of an Issue is no longer active once all of its Signals pass their deactivation window, see Signal Delay. The Issue remains Active for a minimum of 24 hours after all Signals deactivate, and longer if a Signal recurs within that window.
Filter the list
Use filters to focus on what matters most:
- Scope: Limit Diagnoses to a specific scope (for example an environment or domain).
- Service: Focus on a particular service.
- Workload: Narrow down to a deployment, job, or workload of interest.
We will add a screenshot of the filtering controls here.
Inspect a single Diagnosis
Opening a Issue shows a few with two tabs:
- Summary: A clear explanation including description, current and potential impact, blast radius, recommended remediation steps, and the evidence supporting the inference.
- Causality graph: A visual explanation of how the system arrived at the Diagnosis, showing the relationships between the observed Signals and the inferred Diagnosis.
- Timeline: A visualization of all Diagnoses, Signals, events, and SLO breaches associated with the Issue, from first detection to resolution.
Description
A high level description of the current Diagnosis is shown in the summary tab.
Impact and Blast Radius
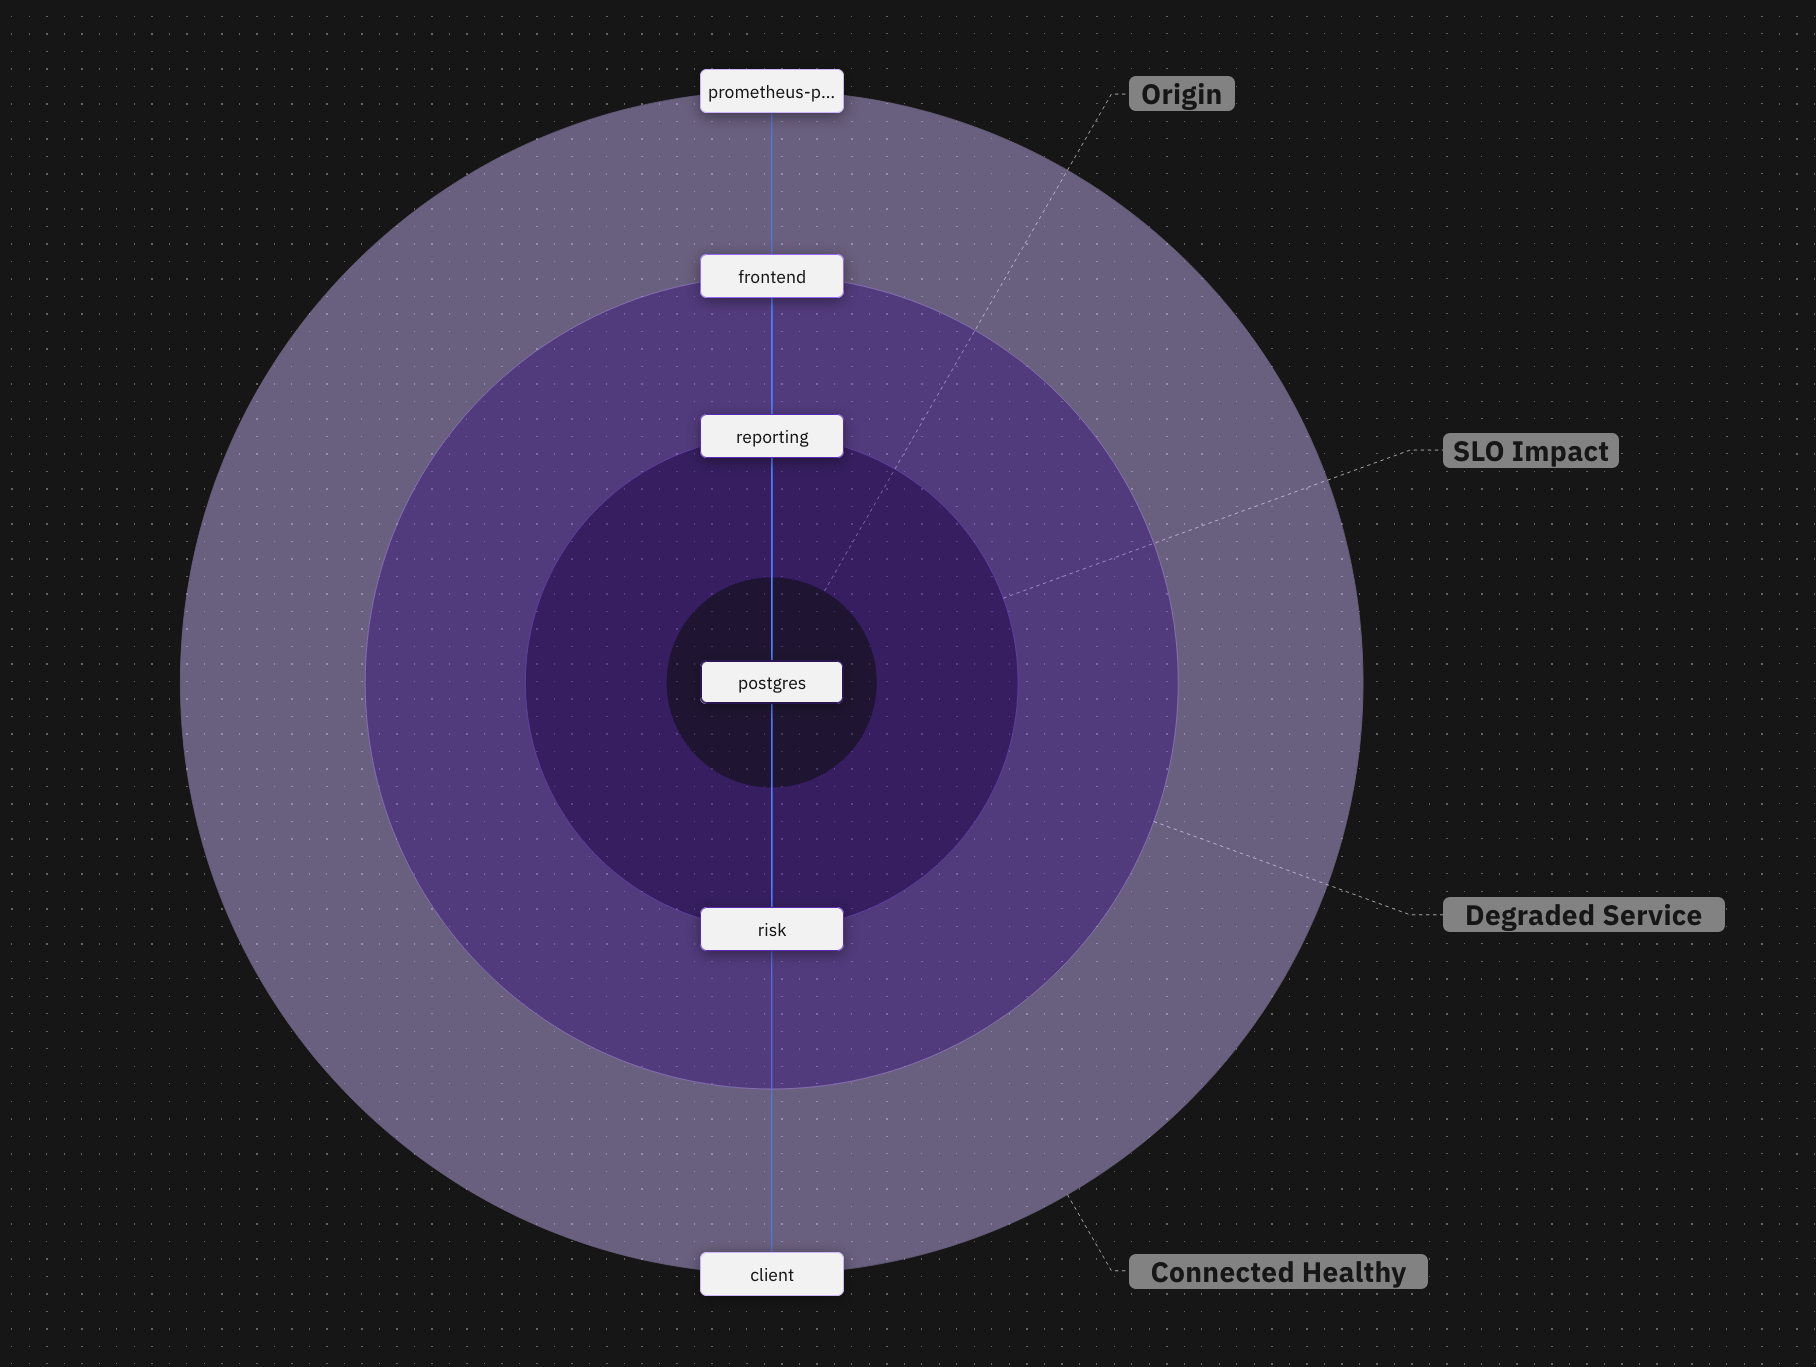
A list of services degraded by the Issue is shown in the summary tab, and a "blast radius" diagram is shown to help visualize the scope of the impact.
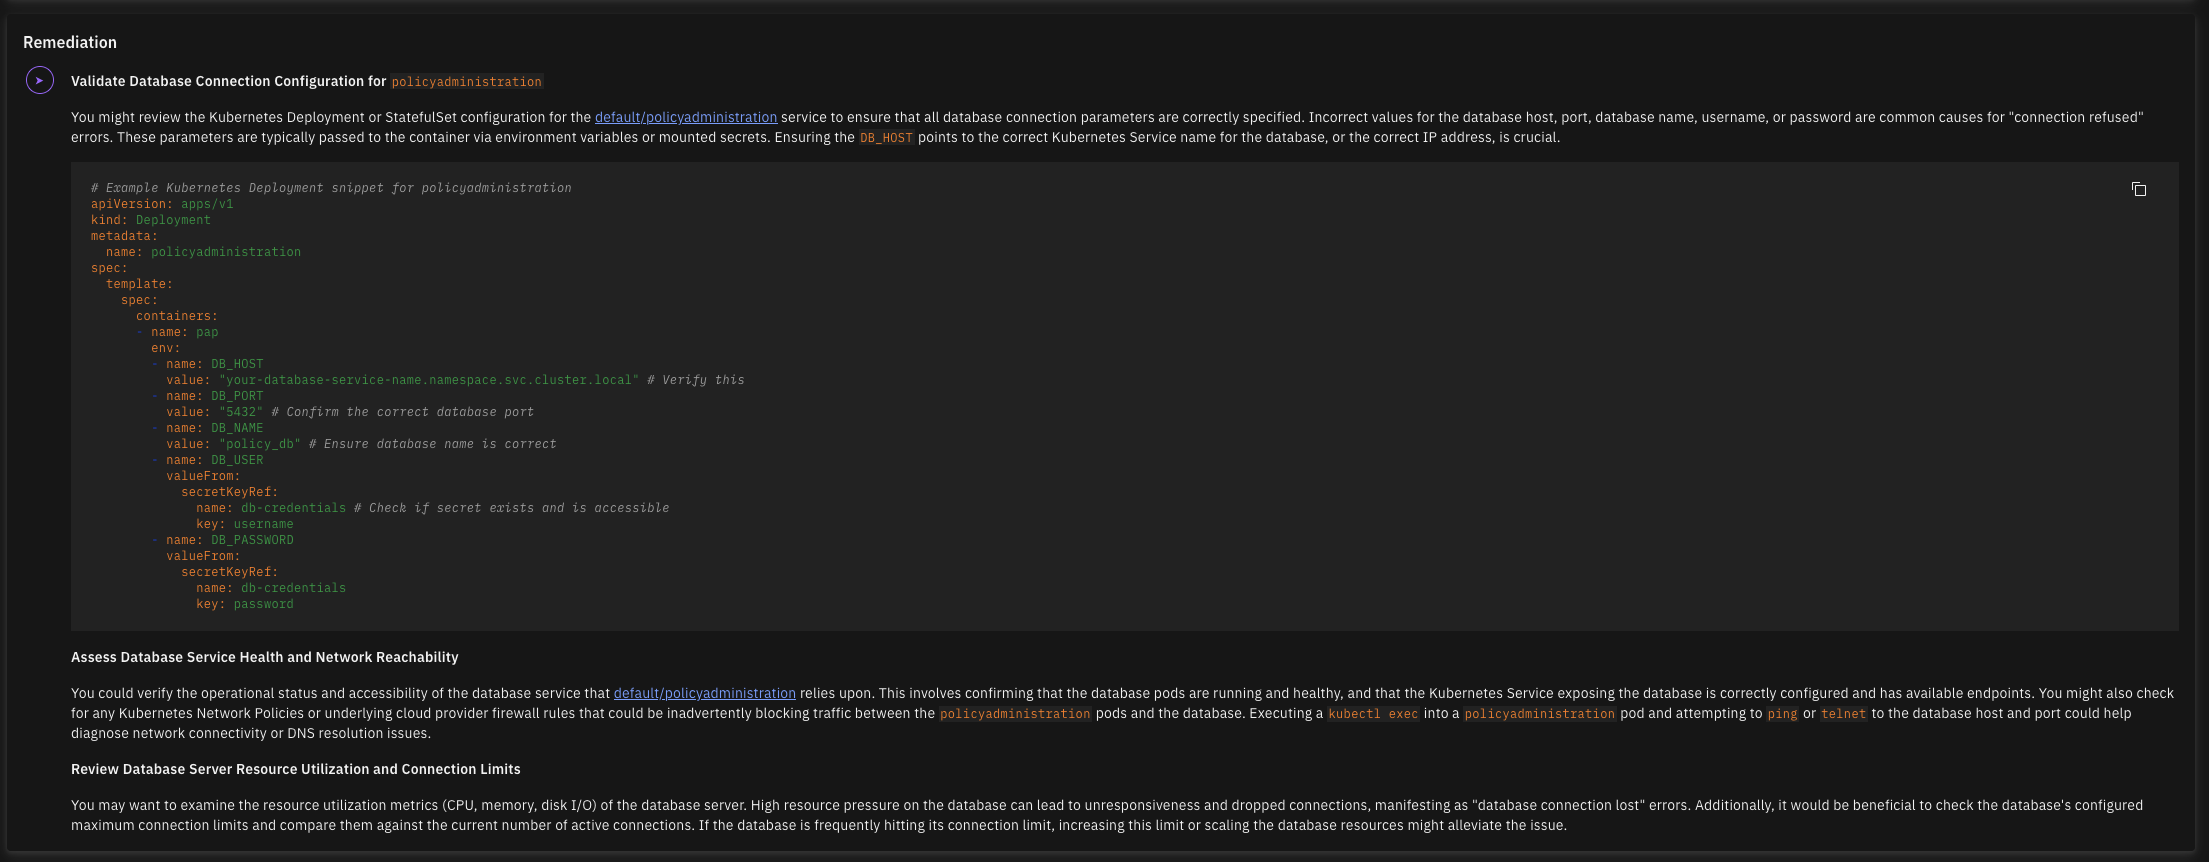
Remediation
A list of recommended remediations to fix the Issue is shown in the summary tab.
Evidence
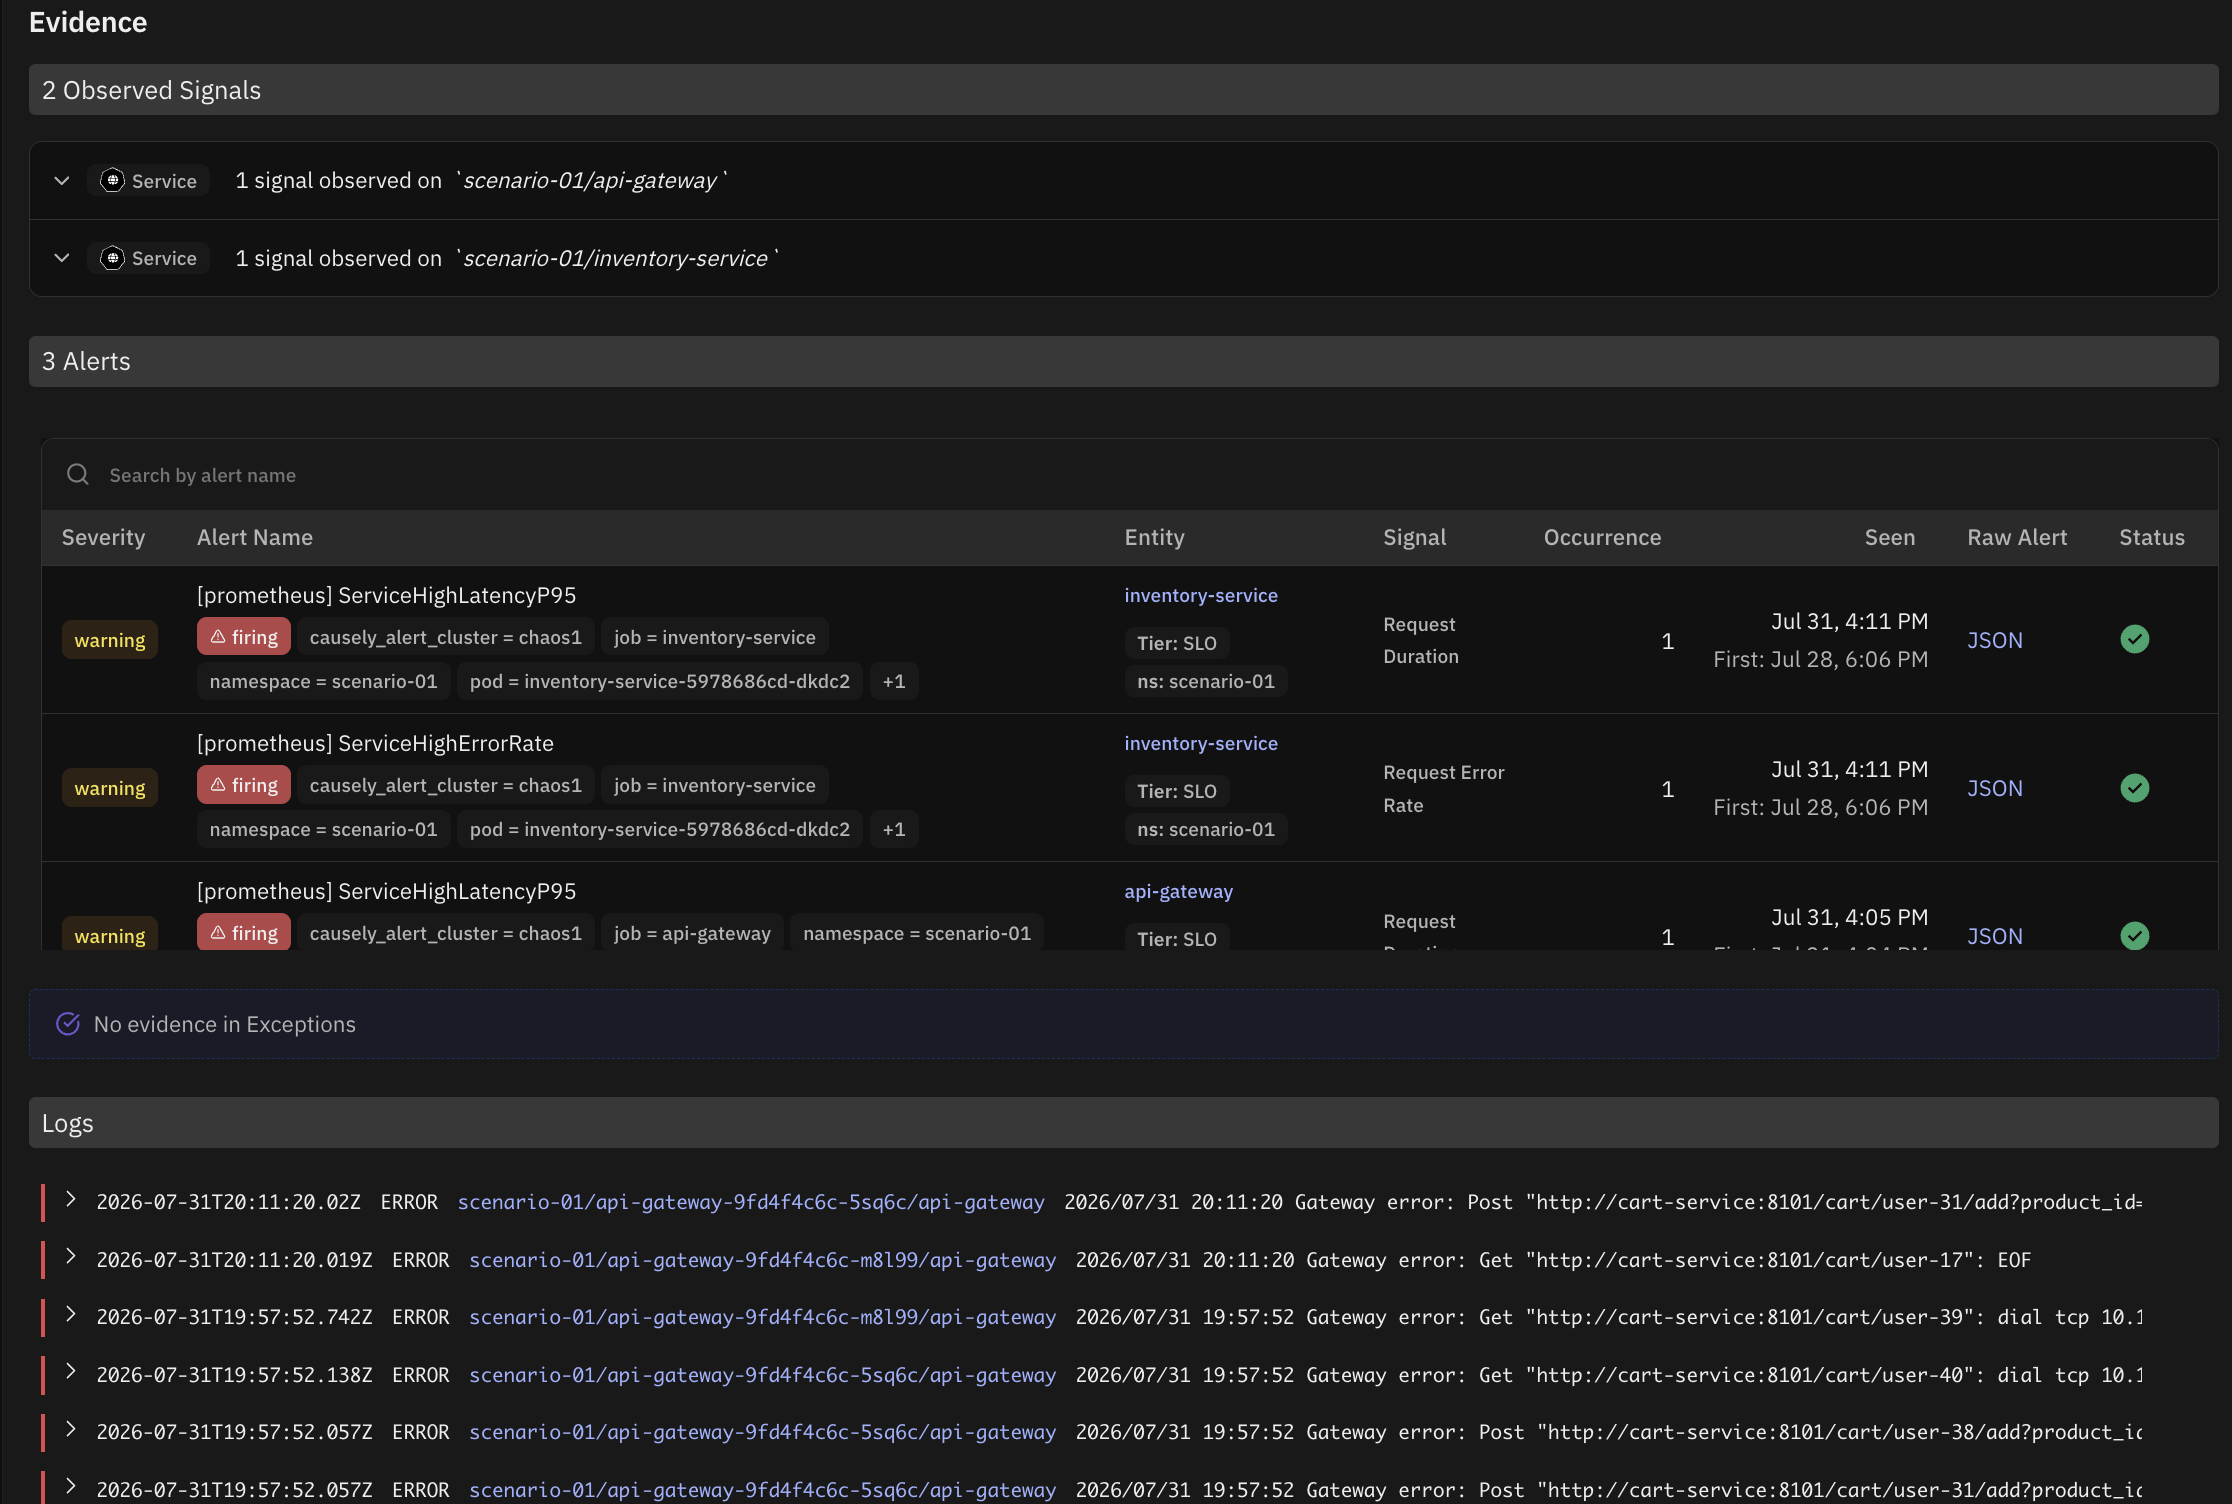
A list of evidence supporting the inference is shown in the summary tab. This includes observed Signals, exceptions, logs, and events.