Welcome Page
The Welcome page gives you a concise, actionable overview powered by the Causely engine: what requires attention right now, how to ask targeted questions, and how your environment has behaved recently.
Welcome page
Urgent Root Cause status
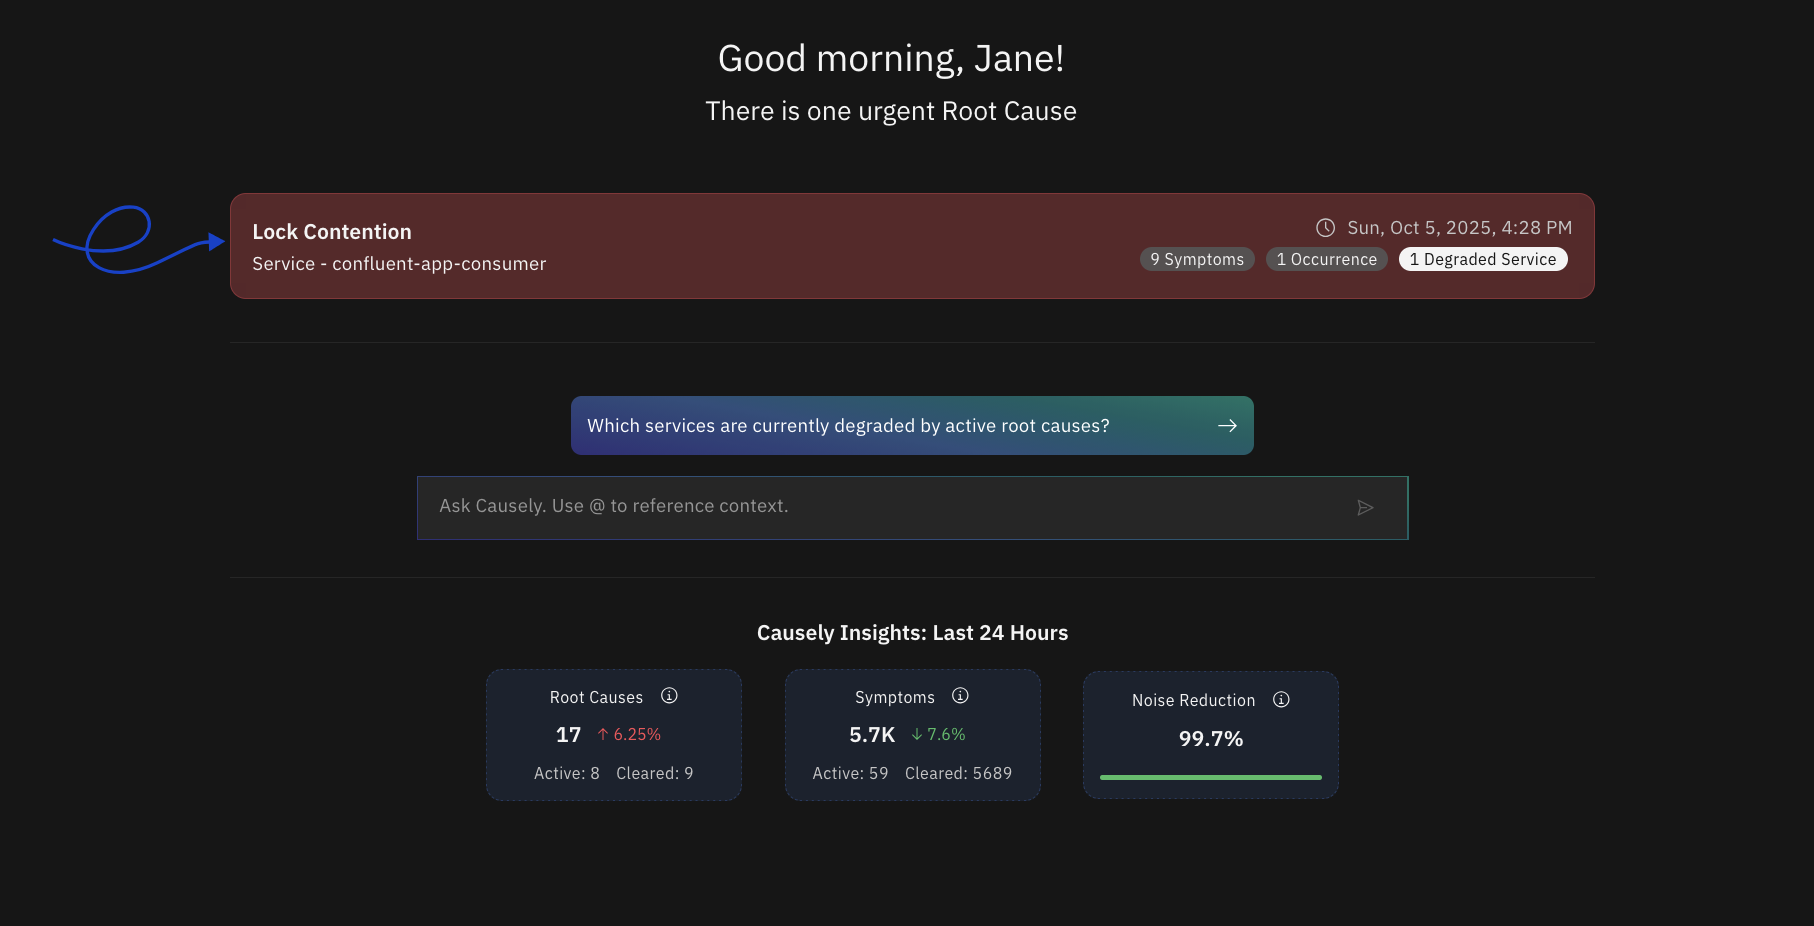
At the top, the page highlights whether there is an urgent cause that needs attention. When one exists, you see a compact card showing the cause title, the affected entity, when it was last observed, the number of linked symptoms, and how many services are degraded. Selecting the card opens the full details so you can review evidence and remediation steps.
If there are no urgent items, the page clearly states that everything is stable and offers a link to review non‑urgent causes. Non‑urgent items are useful for prevention and continuous improvement.
Ask Causely
Ask Causely is available directly on the page, with suggested questions to get you started. Click a suggestion to prefill the prompt, or type your own and use @‑mentions to reference entities, services, or scopes. Typical prompts include:
- Which services are currently degraded by active root causes?
- What changed around a given time window?
- Show the blast radius for a specific service.
Results link you to the corresponding views (Root Causes, Services, or Metrics) already filtered to your context.
Causely Insights
Insights summarize recent activity to help you spot trends without leaving the page:
- Root Causes: The number observed over the last 24 hours, with an indication of how many are currently active versus cleared.
- Symptoms: The number observed over the last 24 hours, including how many remain active.
- Noise Reduction: The percentage reduction in alert noise provided by the system compared to a baseline, illustrating how much distraction has been eliminated.
Each card links to a deeper view, so you can pivot from the high‑level indicators into detailed lists and timelines.