Latest Releases
Each release of Causely includes new features, bug fixes, and performance improvements. This page provides highlights of the most recent releases.
Have ideas, questions, or feedback? Please reach out to us at community@causely.ai.
Overview
Each release of Causely includes new features, bug fixes, and performance improvements. This page provides highlights of the most recent releases.
To get details on older releases, please go to the changelog page, listing all releases.
February 19, 2026
Version v1.0.116Expanded Alert Mapping Support (HTTP Paths, Kafka Topics, JVMs)
Causely now supports alert mapping for:
- HTTP Paths
- Kafka Topics
- JVMs
This enhances Causely's ability to ingest and interpret alerts from systems such as Alertmanager, Mimir, Datadog, and others.
Mapped alerts are incorporated as symptoms in the causal model, allowing Causely to leverage the signals you already trust and use them as structured inputs into deterministic root cause analysis.
Improved Asynchronous Dataflow Understanding
We've enhanced the dataflow graph to provide a more complete view of asynchronous interactions.
Previously, the graph showed only queue publishers (e.g., RPC methods, service tasks, background operations). It now reflects the full lifecycle of a queue, including:
- Operations that consume from the queue
- Upstream and downstream services, RPC methods, or HTTP which are part of the flow
- End-to-end propagation across asynchronous boundaries
This provides a more accurate system-level view of cause and effect across distributed workflows, especially where queues introduce delayed or indirect impact.
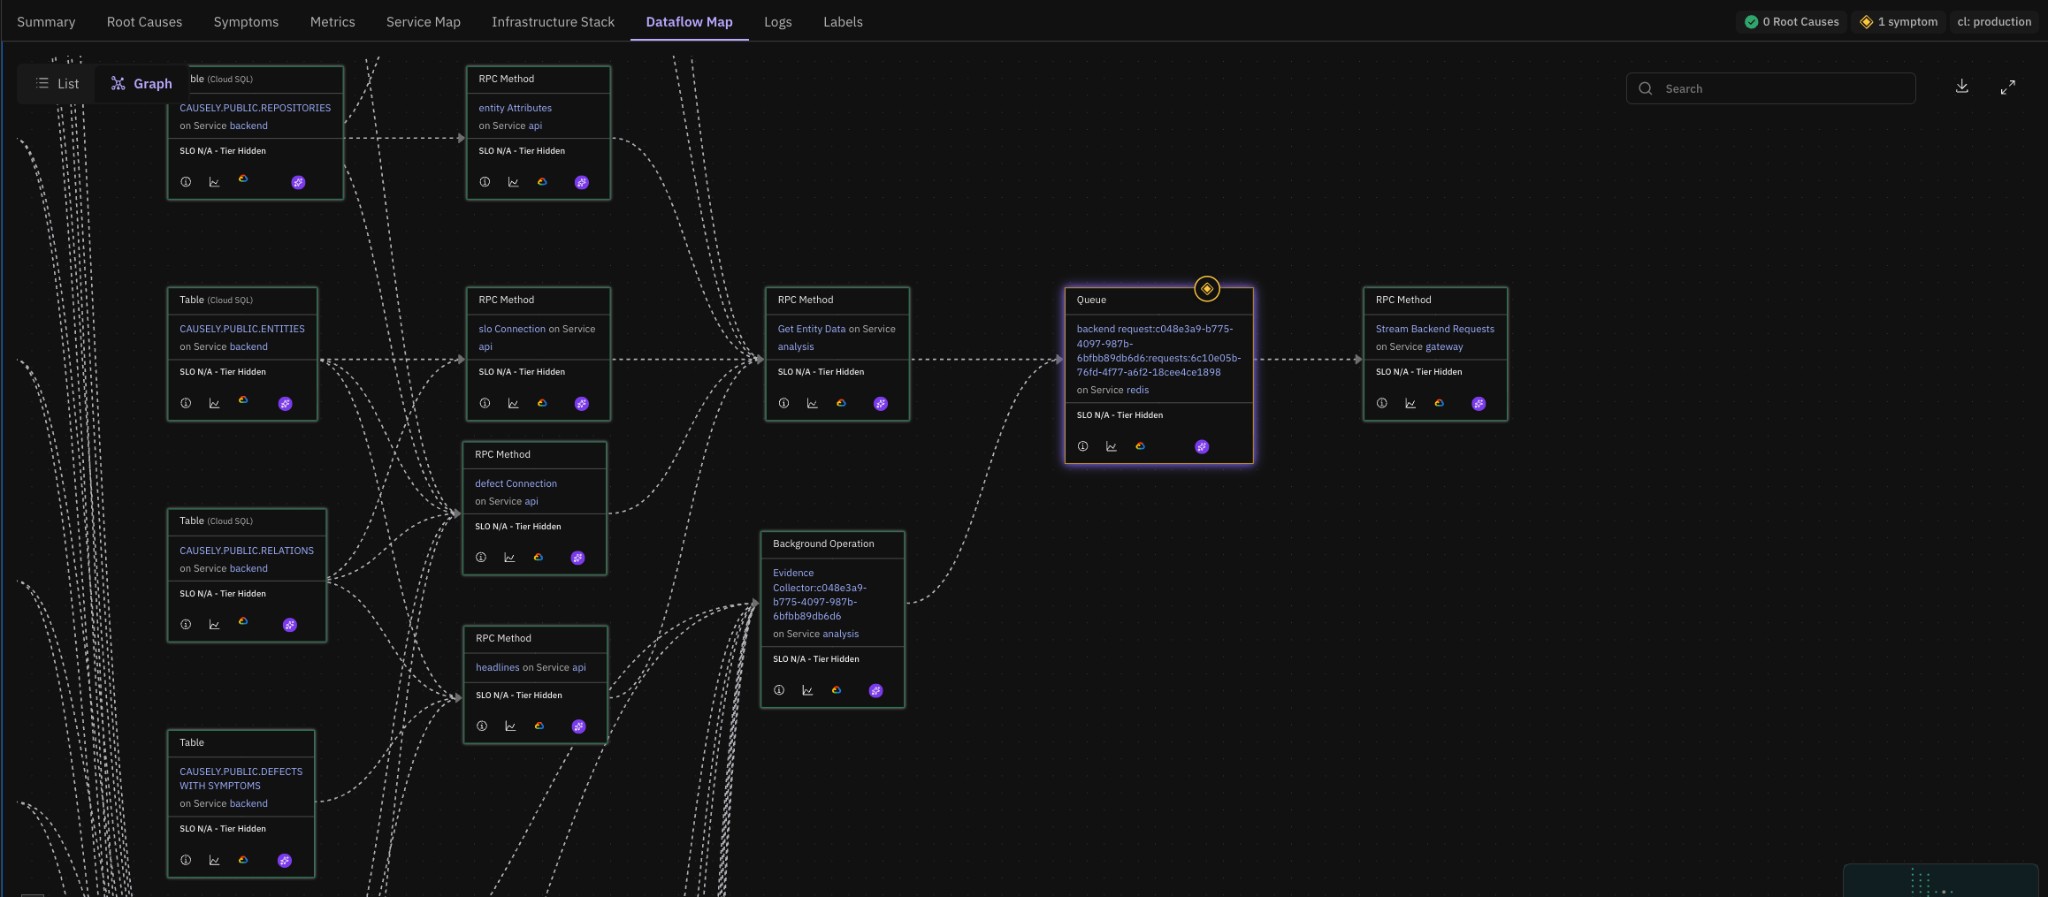
The Dataflow Map tab now shows the full queue lifecycle—publishers, the queue itself (e.g. on Redis), and consumers—so you can trace cause and effect across asynchronous boundaries.
SLOs for Queues (API)
You can now assign SLOs to specific queues that support critical product and user flows. This is currently configurable via the API. When a queue SLO is at risk or violated, any root causes affecting that queue or its upstream dependencies are automatically elevated as urgent. This ensures teams prioritize issues that directly impact key business workflows.
Example: If you need to ensure that an order-processing queue is drained within a defined time window, you can define an SLO using Queue Depth (or a related metric) as the SLI. Causely will then treat violations or burn risks as high priority and surface the most relevant causal explanations with an Urgent severity.
Minor Improvements
- OpenTelemetry integration health: Prevent Causely-generated entities from being re-reported via OpenTelemetry
- Copilot improvements: Improved answer quality when asking questions about Causely documentation in Ask Causely
- Snapshot selection: Improved visibility and selection of snapshots for Reliability Delta workflows
- Entity root cause history: Active and historical root causes are now shown directly on the entity view (for example a service or RPC method)
February 5, 2026
Version v1.0.114Alert Mapping and Root Cause Context
We've enhanced support for ingesting alerts from Alertmanager, Prometheus, Mimir, incident.io, and Datadog to make it easier to understand the actual root cause behind alert noise.
Ingested alerts are now explicitly mapped to symptoms and shown in the context of the inferred root cause. This reduces the toil of chasing individual alerts and helps teams focus on resolving the underlying issue instead of investigating symptoms in isolation.
You can also view alerts over time and see which symptoms and root causes they mapped to, making it easier to understand alert behavior patterns and their real impact.
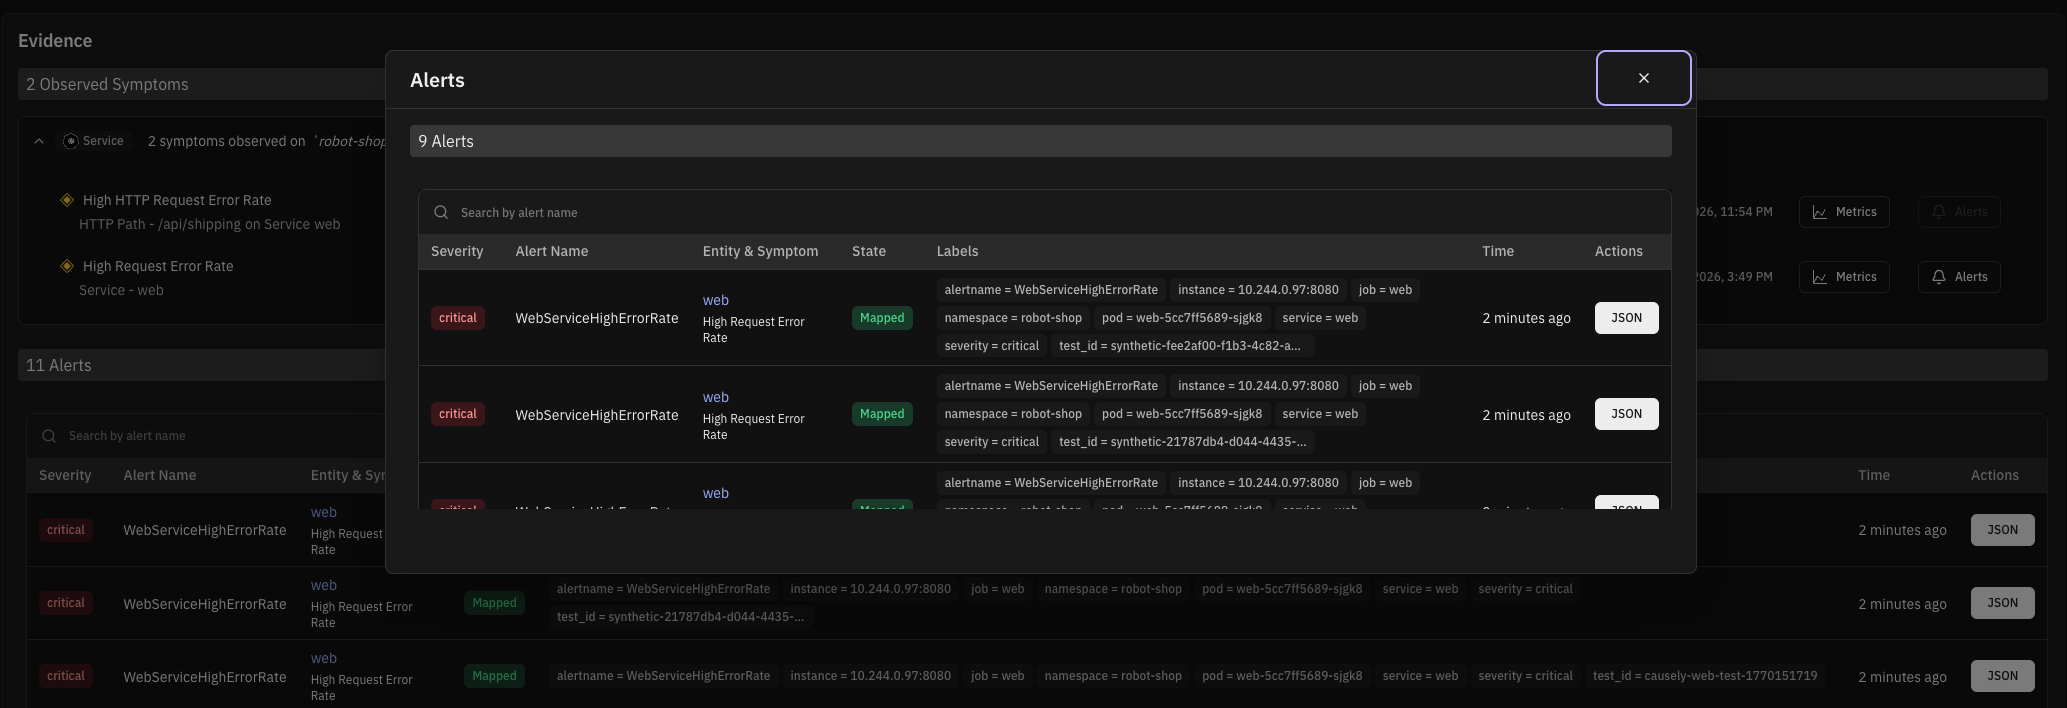
Alerts are mapped to symptoms and shown in the context of the inferred root cause, so you can see which underlying issue each alert points to.
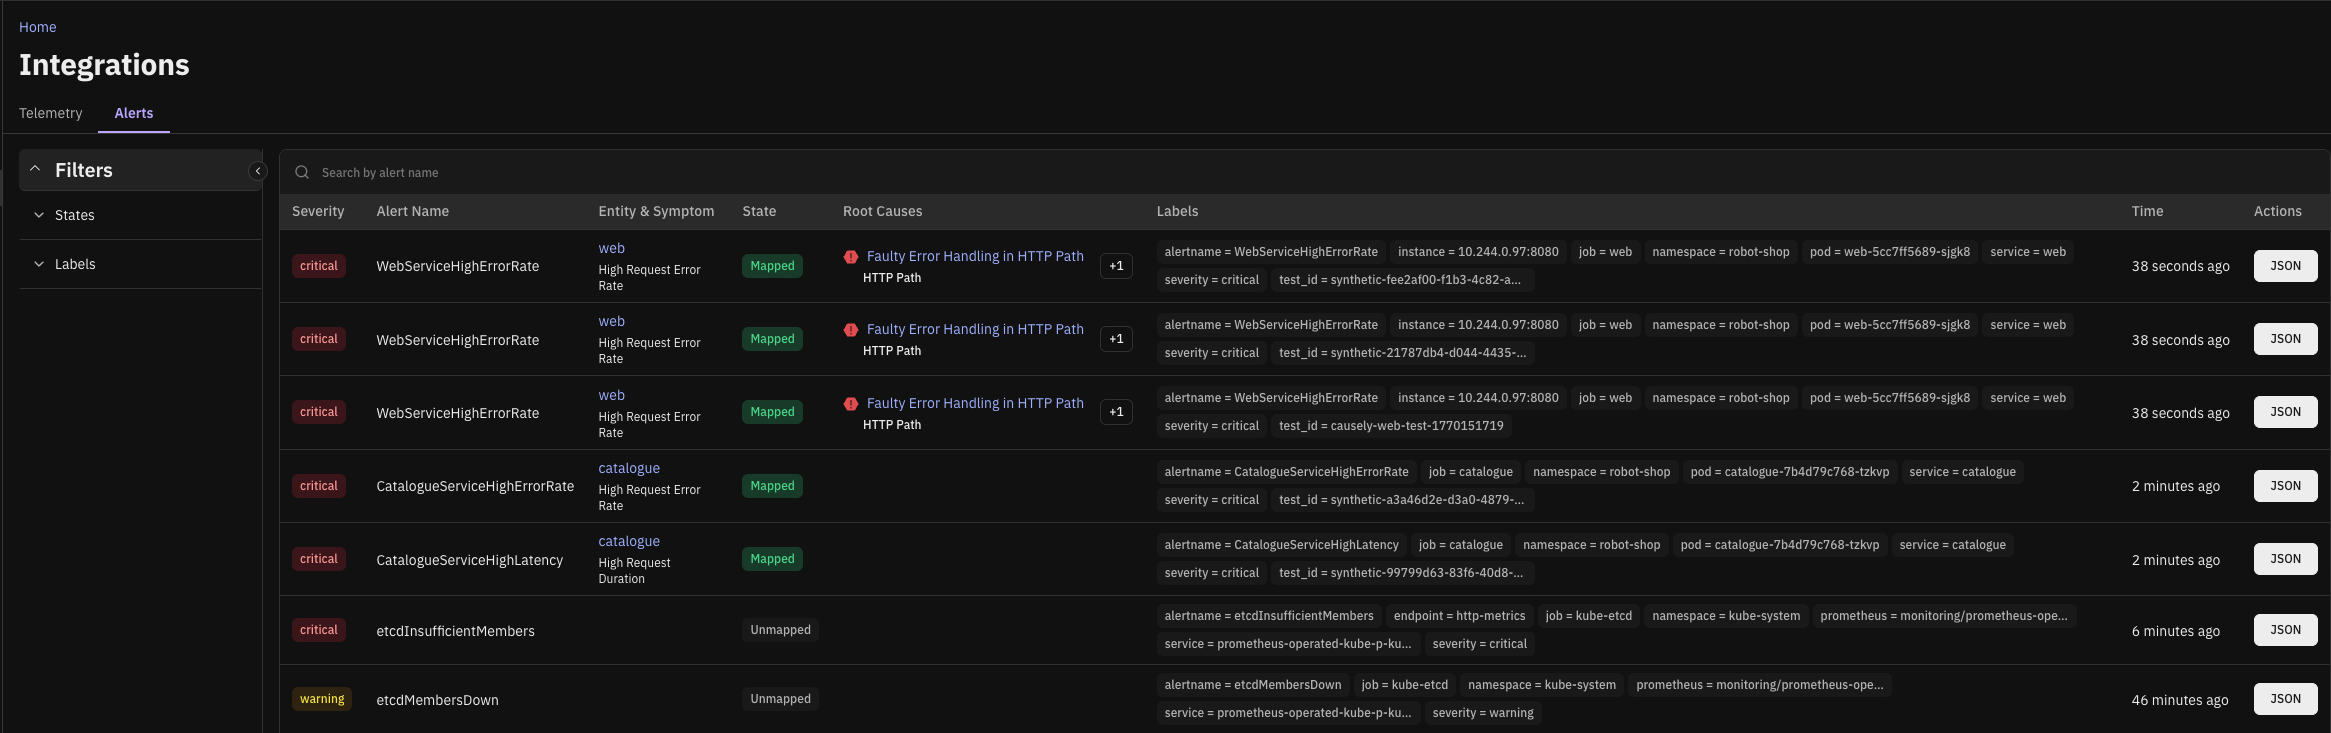
A more complete view of which alerts mapped and which did not gives you confidence that Causely understands what's important to you (or not).
Google Cloud Pub/Sub
We’ve expanded support for asynchronous dataflows to include Google Cloud Pub/Sub.
Cloud Pub/Sub is now modeled as a first-class asynchronous service type, allowing teams to understand how message-driven workflows contribute to incidents and root causes without stitching together dashboards or relying on black-box summaries.
Minor Updates
- Credential auto-discovery for PostgreSQL
- Improved AWS SQS queue discovery
- Ensured queues and exchanges are visible within a defined scope
- Improved how dataflow graphs are rendered for queues
- Added support for GCP authentication using Workload Identity Federation for GKE
January 26, 2026
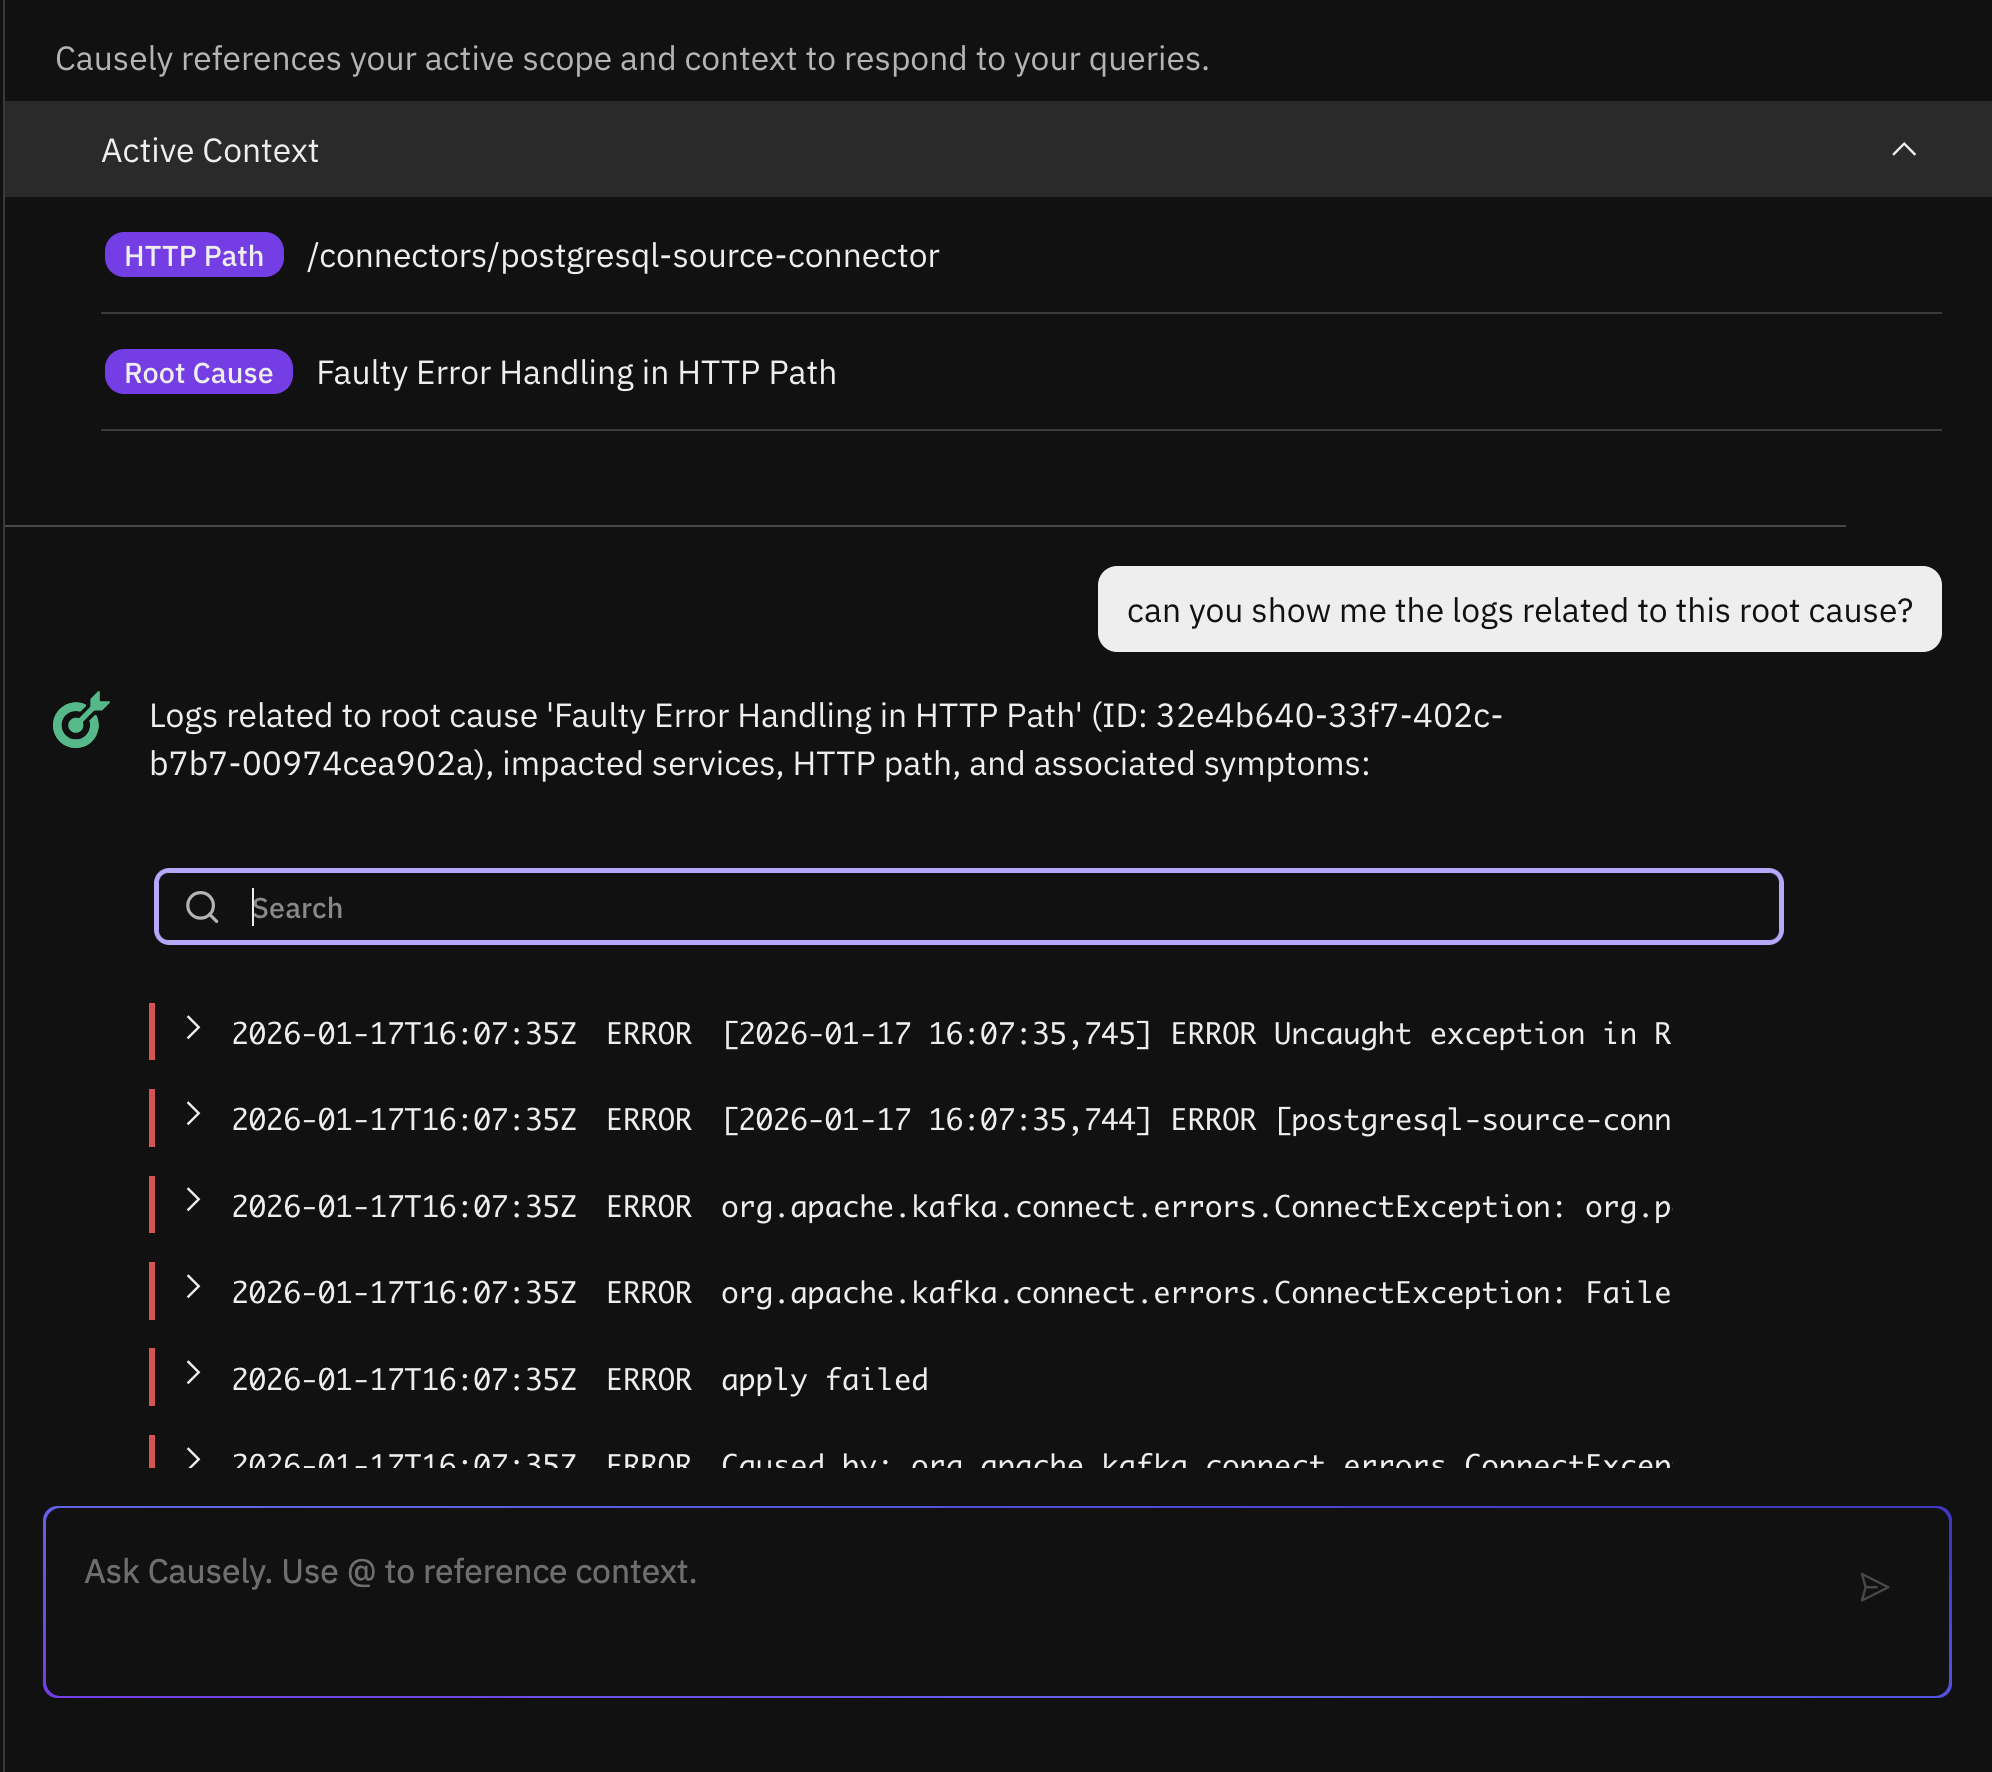
Version v1.0.110Ask Causely: Natural Language on Logs and Alerts
Ask Causely can now answer follow-up questions about logs associated with a specific root cause. Causely already infers the true root cause using its causal model and automatically correlates relevant errors and warnings from the affected services or containers. With this update, you can dig deeper by asking targeted questions to filter and retrieve specific logs, such as:
- "Can you show me all the error level logs associated with this root cause?"
- "Can you show me the logs related to Kafka on this root cause?"
Ask Causely also better understands alerts. If you paste an alert from Prometheus or Datadog, it can identify the underlying root cause or determine that the alert is spurious, with clear evidence so you don't waste time investigating noise.
Minimum Threshold for Learned Latency
You can now configure a minimum value for Causely's learned latency (request duration) thresholds. By default, thresholds are learned from the p95 request duration over the last 24 hours, which can become too sensitive in low-traffic scenarios. The minimum threshold prevents unnecessary noise, for example when traffic dips over the weekend and spikes on Monday.
This can be configured for services via the UI, and for HTTP paths or RPC methods via the API.
Prioritizing Dataflows with SLOs (API-only)
You can now assign SLOs to specific HTTP paths or RPC methods to prioritize critical user flows. This is currently configurable through the API. When an SLO is at risk or violated, any root causes affecting that endpoint or its upstream dependencies are automatically treated as urgent. This helps teams focus on issues that directly impact key business journeys, such as checkout.
Minor Improvements
- Improved Kubernetes API caching to support clusters with thousands of nodes while reducing API load
- Added support for connecting to remote Kubernetes clusters for service discovery without deploying a mediator in every cluster
- Improved OpenTelemetry trace support in standalone Docker environments so traces connect correctly to relevant entities
- Removed scope constraints when defining notification filters for more flexible alert routing
More Releases
Go to the changelog page.