Kubernetes
- Infrastructure Entities - Complete infrastructure topology including compute, storage, and networking resources
- Logs - Application and container logs for correlation with root causes
- Metrics - Performance metrics from applications and infrastructure
- Service Discovery - Automatic discovery of services, workloads, and infrastructure components
- Symptoms - Automatic symptom detection from metrics, traces, and external monitoring systems
Overview
Causely provides native, out-of-the-box integration with Kubernetes that automatically discovers and monitors your entire container infrastructure. When you install Causely using our standard Helm or CLI installation, Kubernetes monitoring is enabled by default with zero configuration required.
The integration provides comprehensive visibility across your entire Kubernetes stack, from cluster-level resources down to individual containers, helping you identify infrastructure issues before they impact your applications.
How It Works
Causely's Kubernetes integration works automatically upon installation:
- Automatic Discovery: The agent automatically discovers all Kubernetes resources in your cluster using the Kubernetes API
- Real-time Monitoring: Continuously monitors resource states, events, and relationships
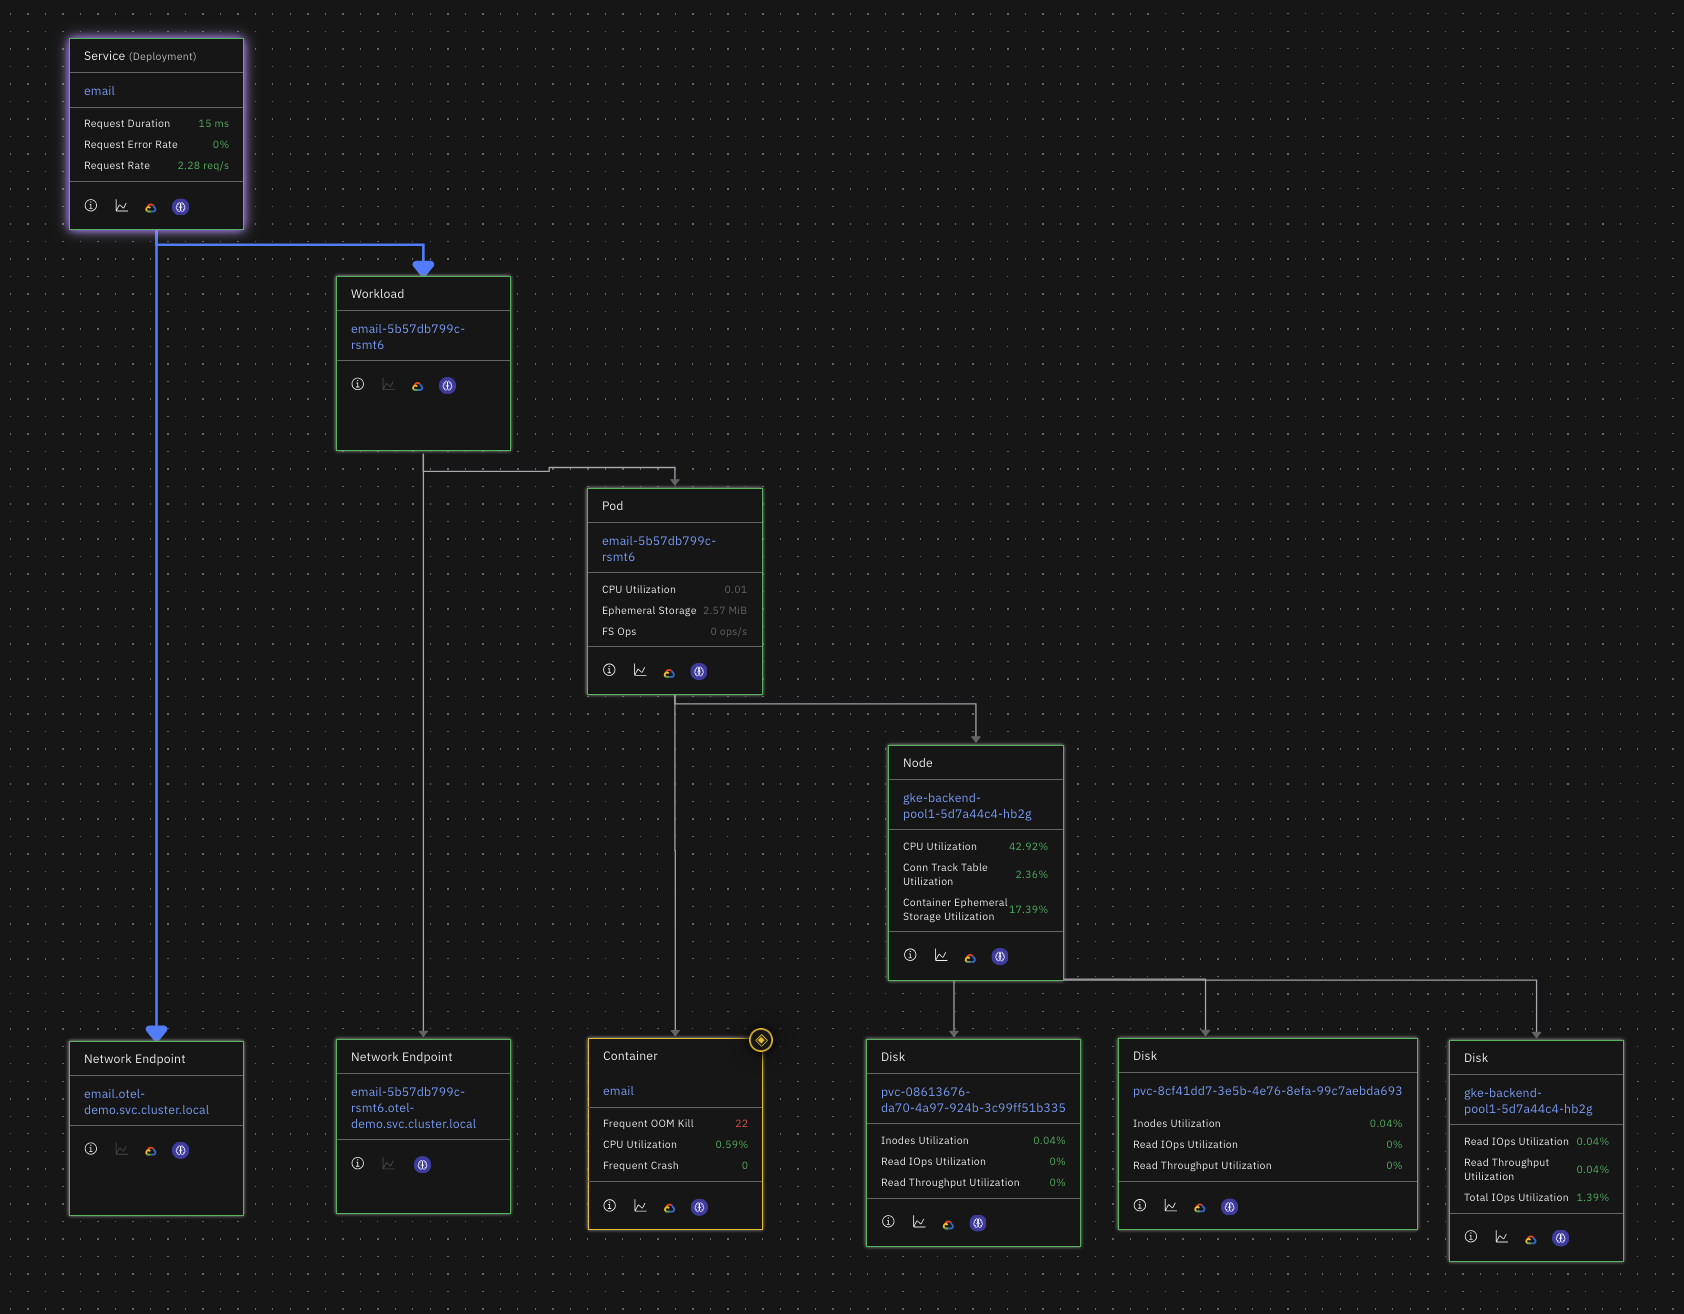
- Entity Modeling: Creates a comprehensive topology graph showing relationships between clusters, nodes, pods, services, and applications
- Event Processing: Analyzes Kubernetes events to detect issues like pod evictions, scheduling problems, and resource constraints
- Root Cause Analysis: Correlates infrastructure issues with application performance problems
- Auto-remediation: Remediate issues automatically by deploying fixes or scaling resources
This approach provides complete infrastructure visibility without requiring any configuration changes or additional setup beyond the standard Causely installation.
Out-of-the-Box Setup
Kubernetes monitoring is enabled by default when you install Causely. Simply follow our standard installation guide:
📦 Install with Helm or 💻 Install with CLI
No additional configuration, secrets, or permissions are required beyond what's included in the standard installation.
Enhanced Log Retrieval
Causely surfaces relevant log lines automatically in the context of active root causes and service malfunctions.
For environments with centralized logging, Causely can retrieve container logs from external sources instead of the Kubernetes API.
This is useful when logs are forwarded to systems like Elasticsearch or Grafana Loki.
External Log Integrations
Causely supports two primary centralized log integrations:
-
Elasticsearch: Retrieve logs directly from Elasticsearch when your containers push logs there.
-
Grafana Loki: Integrate with Loki for scalable log aggregation and querying through Grafana.
When either integration is configured, Causely prioritizes external log sources over the Kubernetes API and automatically falls back to Kubernetes logs if the external system becomes unavailable.
What You Get
Infrastructure Topology
- Complete service map showing relationships between applications, services, and infrastructure
- Multi-layer visualization from business applications down to individual containers
- Dependency tracking across namespaces and resource types
Workload Monitoring
- Controller analysis for Deployments, StatefulSets, DaemonSets, Jobs, and CronJobs
- Pod lifecycle tracking including scheduling, running, and termination states
- Container health monitoring with resource usage and state information
- Configuration change detection for container images, resources, environment variables, and volume mounts
Resource Management
- Node health monitoring with conditions like memory pressure, disk pressure, and network availability
- Persistent volume tracking with usage and binding information
- Service discovery with automatic endpoint creation and load balancer mapping
- Ingress routing analysis for external traffic patterns
Event Analysis
- Pod eviction detection for memory pressure, disk pressure, and resource constraints
- Scheduling failure analysis for unschedulable pods
- Image pull error tracking for deployment issues
- Configuration change events for version updates and resource modifications
Application Integration
- Service-to-pod mapping for application relationship discovery
- Network endpoint creation for service communication analysis
- Load balancer and ingress integration for external access patterns
- Kafka resource discovery for message queue topology (if using Strimzi operator)
Enhanced Log Retrieval
- Multi-source log collection from Kubernetes API, Elasticsearch, and Loki
- Elasticsearch integration for centralized log analysis when logs are forwarded from containers
- Loki integration for scalable log aggregation and querying
- Priority-based retrieval with automatic fallback to Kubernetes API
- Authentication support for secured log aggregation systems
Root Cause Detection
The Kubernetes integration enables detection of infrastructure-related causes including:
Node-Level Issues
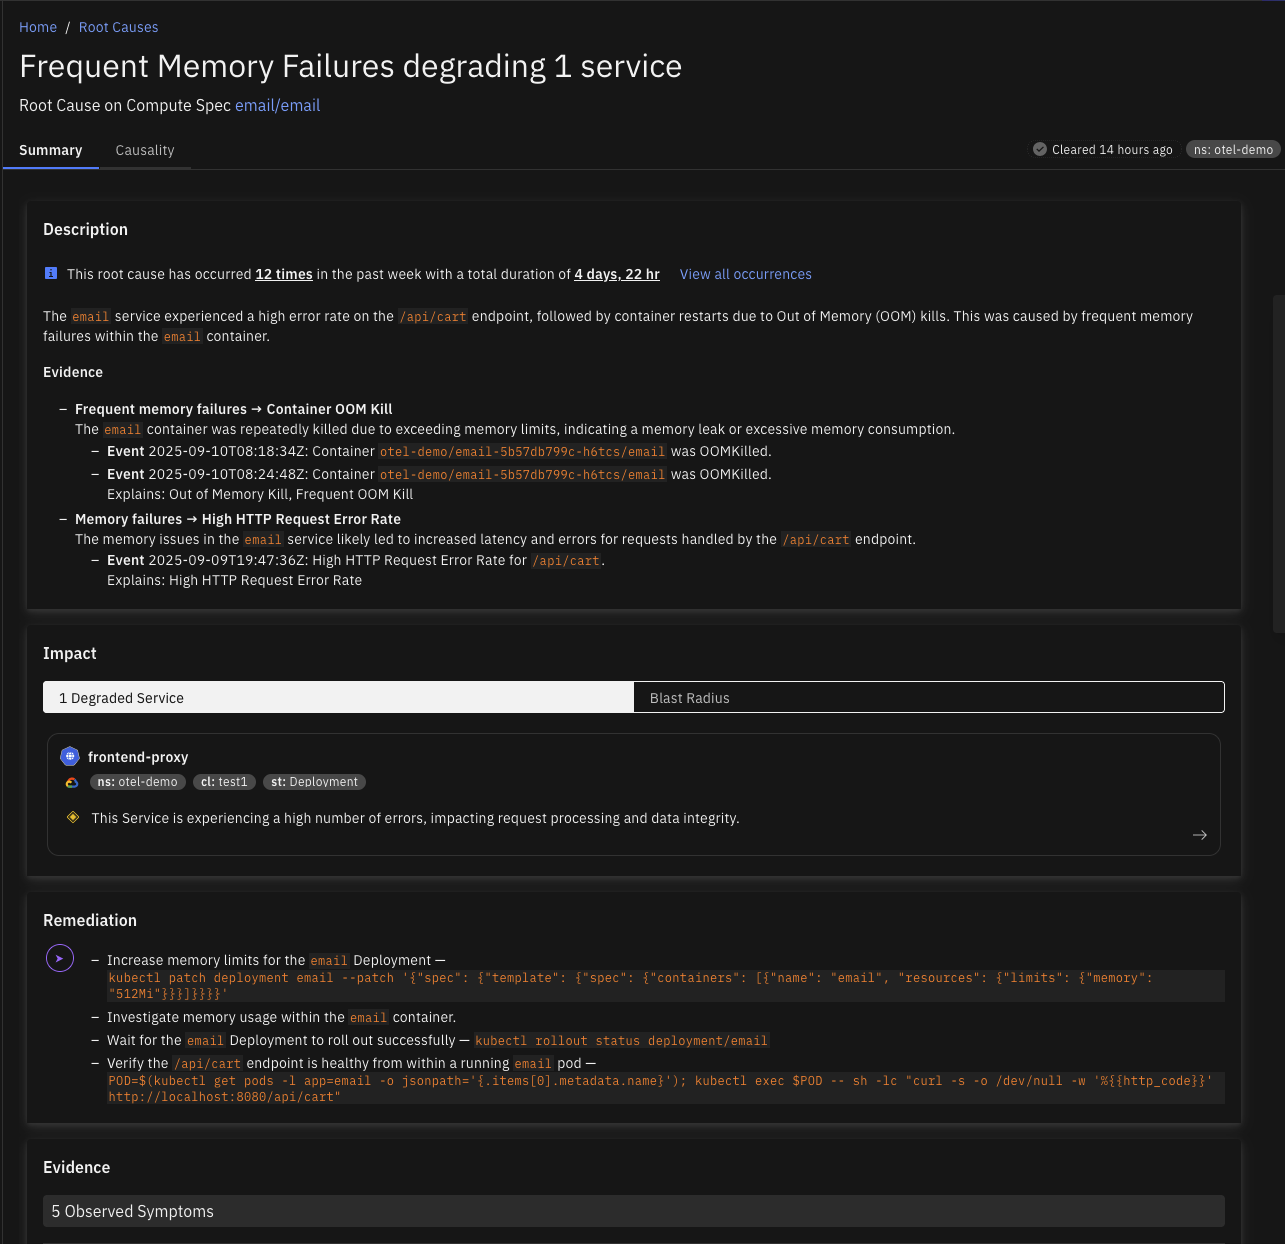
- Disk Pressure - Node disk usage triggering pod evictions
- Memory Pressure - Node memory exhaustion causing pod evictions
Controller and Workload Issues
- Controller Malfunction - Multiple pods in NotReady state
- Image Pull Errors - Pods failing to start due to registry issues
- FrequentPodEphemeralStorageEvictions - Pods evicted due to storage limits
Container Resource Issues
- CPU Congested - Container CPU throttling and performance degradation
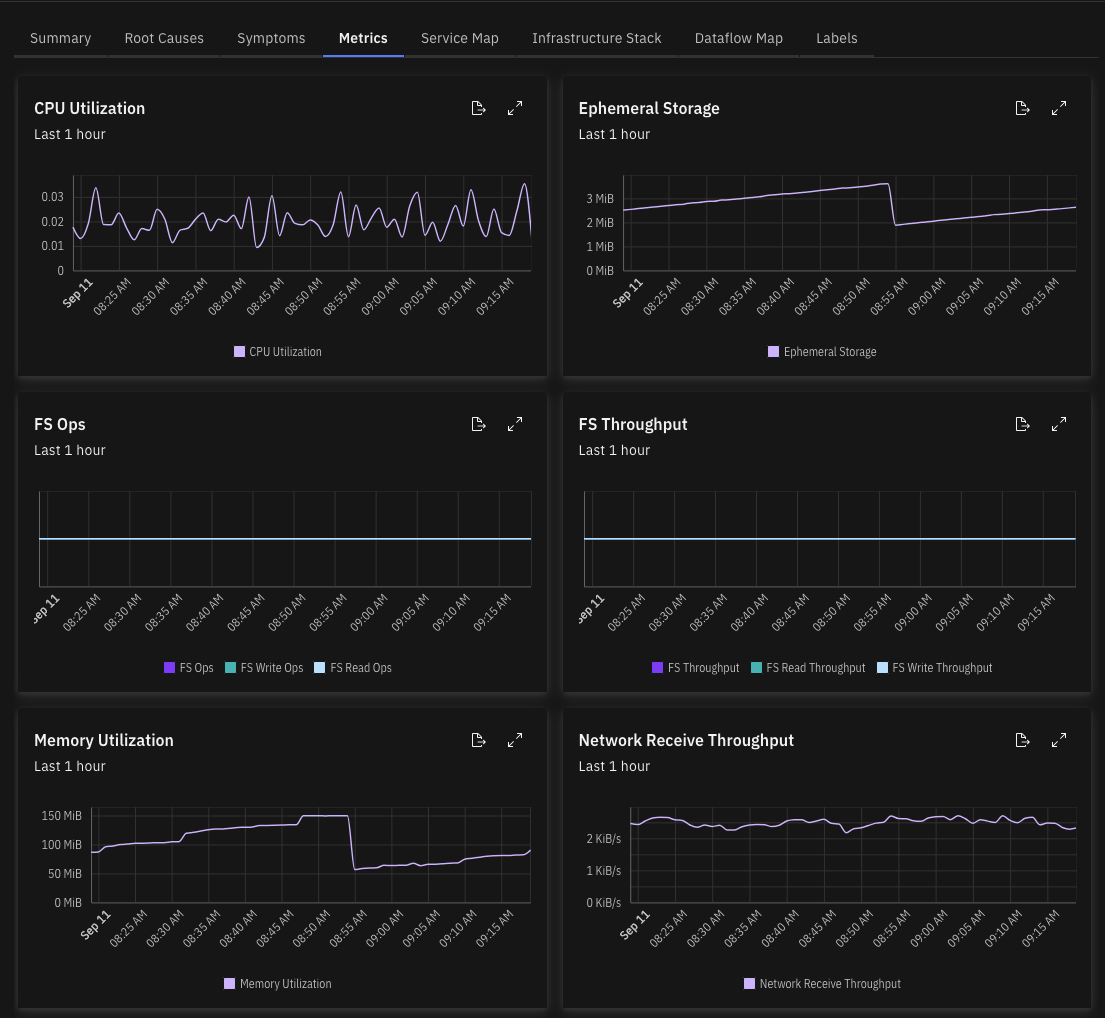
- Memory Failure - Container out-of-memory kills
- Frequent Memory Failure - Repeated memory-related crashes
- Crash Failure - Container crashes with non-zero exit codes
- Frequent Crash Failure - Repeated container crashes
Storage and Noisy Neighbor Issues
- Ephemeral Storage Congested - Container storage usage causing failures
- Ephemeral Storage Noisy Neighbor - Container consuming excessive storage affecting node
- Memory Noisy Neighbor - Container consuming excessive memory affecting node
- Disk Congested - Persistent volumes reaching capacity limits
Service-Level Issues
- Service Congested - Kubernetes services experiencing high latency
- Service Malfunction - Kubernetes services with high error rates
Release-Related Issues
- Code Change Regression: CPU Congestion - Performance degradation after deployments
- Code Change Regression: Memory Failure - Memory issues introduced by new versions
What Data is Collected
The Kubernetes integration automatically collects comprehensive metadata and state information, including:
Cluster-Level Resources
- Cluster identity and configuration
- Node specifications and health conditions
- Namespace organization and resource quotas
- Custom resource definitions and operators
Workload Resources
- Pod specifications including containers, volumes, and resource requirements
- Controller configurations for Deployments, StatefulSets, DaemonSets, Jobs, and CronJobs
- Service definitions and endpoint mappings
- Ingress rules and traffic routing configuration
Runtime Information
- Container states and restart counts
- Resource utilization and capacity limits
- Event logs for troubleshooting and analysis
- Container logs from Kubernetes API, Elasticsearch, or Loki (when configured)
- Configuration changes and version history
Relationships and Dependencies
- Service-to-pod mappings for application topology
- Pod-to-node assignments for infrastructure placement
- Volume bindings and storage relationships
- Network connectivity patterns and endpoints
The Kubernetes integration respects your cluster's RBAC policies and only accesses resources that the Causely service account has permissions to read. All data collection uses read-only Kubernetes API calls.