v1.0.133
New MCP tool
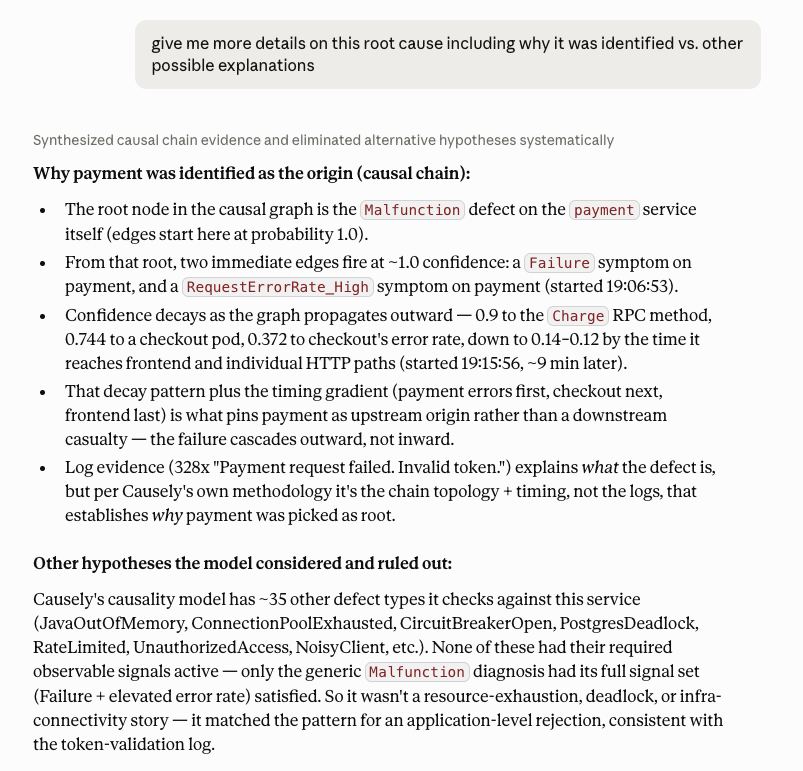
Causely now splits root cause access into two tools. get_root_causes returns a summary of active root causes, and the new get_root_cause_details tool returns the full detail for a single root cause: the causal chain explaining why it was identified, blast radius, symptoms, exceptions, events, and logs.
Previously agents received full detail on every root cause in a single call, which filled the context window with data they did not need yet. Now an agent scans the summary first, then pulls detail only for the root cause it decides to investigate. This keeps responses lean and lets the agent control when it spends tokens on depth.
Faster MCP tool responses
MCP tool responses are now about 30% faster on average, and 80% or more faster in some cases.
Agents spend less time waiting between steps, so an investigation or fix moves from one action to the next with less delay.
Grafana alerts
Causely now ingests alerts from Grafana.
If your team runs alerting through Grafana, those alerts feed into Causely and get mapped to symptoms automatically, the same way Prometheus alerts already do. You get causal analysis on the alerts you already have, with no change to how you alert today. Active alerts turn on the matching symptoms and clear when they resolve, so Causely stays in sync with what Grafana is firing.
Minor Improvements
- Docker trace processing: Improved trace processing in stand-alone Docker environments.
- Self-hosted agent auth: Improved MCP authentication for self-hosted coding agents, for example Cline.
- Controller root cause diagnosis: Improved the detection logic for Controller Malfunction and Image Pull Error root causes for more accurate diagnosis.