v1.0.134
Expanded Dynatrace Support
Causely now ingests how data flows between application components and underlying infrastructure directly from Dynatrace instrumentation, including public cloud and on-prem environments such as VMware. Your existing Dynatrace infrastructure alerts now inform the model automatically, mapping to infrastructure symptoms Causely already tracks, alongside the application-layer alerts already mapped. This makes it easier to put Causely's semantics and causal model on top of your Dynatrace instrumentation wherever your applications run, so you reach the cause of alerts faster and dramatically reduce alert noise and MTTR. You can also connect that semantics to an AI agent for autonomous remediation.
More Specific Root Cause Names
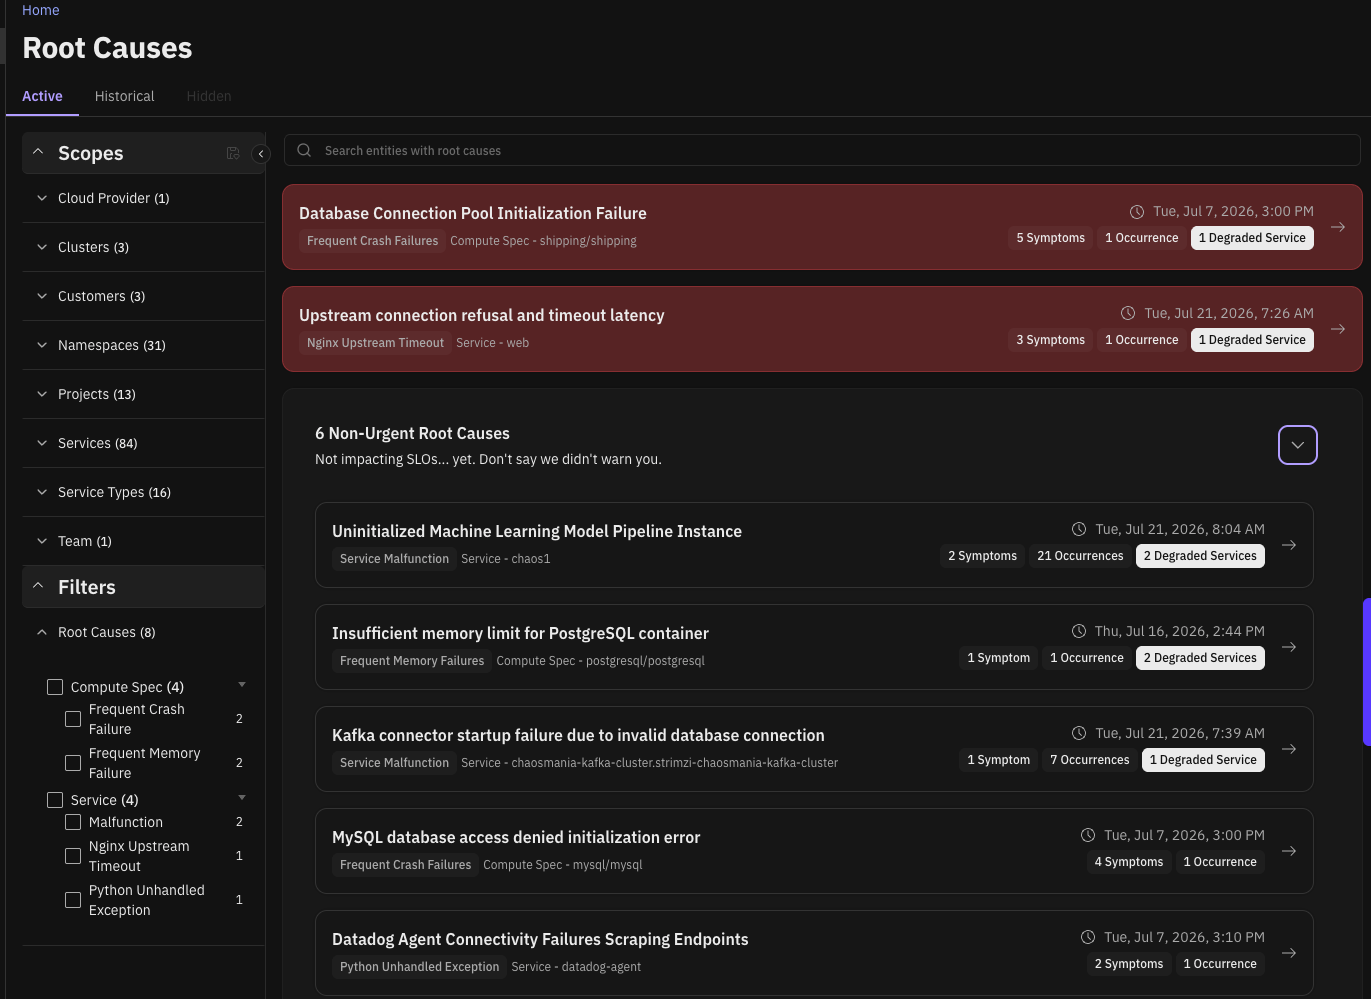
Root cause names in the UI are now titled from the specific evidence collected in logs, metrics, and events. Generic names made it hard to tell active issues apart when scanning an environment with several at once. The root cause type, for example Service Malfunction, now appears as a tag you can filter on, so you get a more accurate read on the underlying cause of a problem or performance degradation.
Horizontally Scalable Mediator
The Causely mediator can now be enabled to scale horizontally. At high trace volumes and span cardinality a single mediator may became a CPU bottleneck, limiting complete trace processing. Span analysis is now offloaded across horizontally scalable pods, so trace processing stays complete even in very large environments. Enabling and correctly sizing this requires configuration; contact our support team for guidance.
Minor Improvements
- Topology: Improved stitching of GCP and AWS Application Load Balancers to Kubernetes services, for a more complete representation of the topology.
- Topology: Health state visualization is more accurate when symptoms are active but no cause has been inferred, or when there is insufficient data to determine current state.
- Notifications: Entity name filtering including regex is now supported.
- SLOs: Availability SLOs now respect service tiers. See service prioritization for detail.
- Prometheus: At large scale, alerts are now processed reliably and mapped to Causely symptoms.
- Prometheus: Active alerts and alert rules discovered from Prometheus are now visible on the Integrations page.
- MCP (get_symptoms): Improved to answer questions such as what deployments happened in a cluster or namespace over a recent window.